Home »
Python »
Python Data Visualization
Python | X-axis Scale Limit
Python | X-axis Scale Limit: In this article, we are going to learn about the X-axis Scale Limit and its Python implementation with example.
Submitted by Anuj Singh, on July 16, 2020
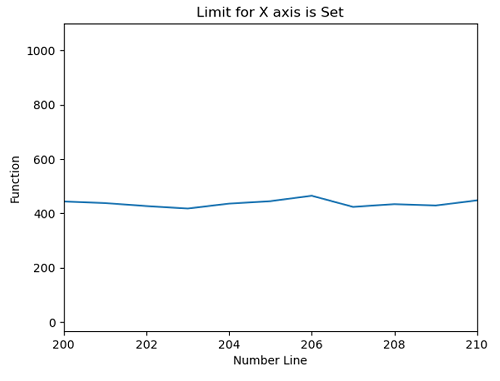
In some cases, we need to visualize our data within some defined range rather than the whole data. For this, we generally set the x-axis scale within a limit and this ultimately helps us to visualize better. Sometimes, it acts as zooming and a very helpful technique in data visualization. Therefore, Matplotlib has a defined function for this operation matplotlib.pyplot.xlim().
Following is an example showing a different X-axis Limit in plots using matplotlib.pyplot.
Syntax:
matplotlib.pyplot.xlim(left_limit, right_limit )
plt.show()
Python code for x-axis scale limit
import numpy as np
import matplotlib.pyplot as plt
x = np.arange(500)
y1 = np.arange(500)
for i in range(500):
y1[i] = 2*x[i] + np.random.randint(0,56)
plt.figure()
plt.plot(x,y1)
plt.xlabel('Number Line')
plt.ylabel('Function')
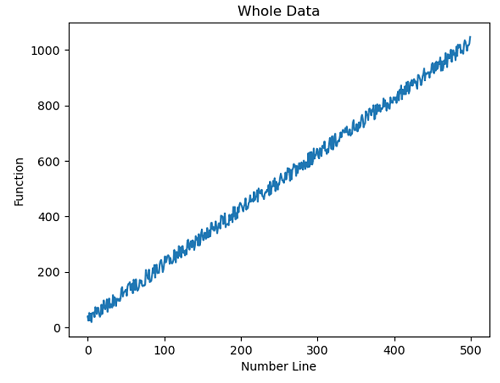
plt.title('Whole Data')
plt.figure()
plt.plot(x,y1)
plt.xlim(200,210)
plt.xlabel('Number Line')
plt.ylabel('Function')
plt.title('Limit for X axis is Set')
Output:
Output is as figure
Advertisement
Advertisement