Home »
Data Science
Statistics in Data Science
Data Science | Statistics: In this tutorial, we are going to learn about the Statistics in Data Science, Data Types, Measures of Variability, Probability Distribution Functions, Discrete Data Distributions, etc.
Submitted by Kartiki Malik, on March 24, 2020
Statistics
Statistics are utilized to process complex issues in reality with the goal that Data Scientists and Analysts can search for important patterns and changes in Data. In straightforward words, Statistics can be utilized to get significant experiences from information by performing scientific calculations on it. A few Statistical capacities, standards and calculations are executed to break down crude information, fabricate a Statistical Model and construe or foresee the outcome. The motivation behind this is to give an extensive review of the fundamentals of statistics that you’ll need to start your data science journey.
Data Types
- Numerical:
Data communicated with digits; is quantifiable. It can either be discrete (limited number of qualities) or consistent (interminable number of qualities).
- Downright:
Qualitative data grouped into classes. It tends to be ostensible (no structure) or ordinal (requested data).
Measures of Central Tendency
- Mean: The normal of a dataset.
- Medium: The center of an arranged dataset; less defenseless to anomalies.
- Mode: The most widely recognized incentive in a dataset; just significant for discrete information.
Measures of Variability
- Range: The distinction between the most elevated and least incentive in a dataset.
- Variance (σ2): Apportions on how to spread a lot of data is comparative with the mean.
- Standard Deviation (σ): Another estimation of how to spread out numbers are in data collection; it is the square foundation of variance
- Z-score: Decides the number of the standard deviations data point is from the mean.
- R-Squared: A factual proportion of fit that demonstrates how much variety of a reliant variable is clarified by the free variable(s); just helpful for straightforward direct relapse.
- Balanced R-squared: A changed variant of r-squared that has been balanced for the number of indicators in the model; it increments if the new term improves the model more than would be normal by some coincidence and the other way around.
Measurement of Relationships between Variables
- Covariance: Measures the fluctuation between (at least two) factors. On the off chance that it's sure, at that point they will move in a similar way, in the event that it's negative, at that point they will in general move in inverse bearings, and on the off chance that they're zero, they have no connection to one another.
- Correlation: Measures the quality of a connection between two factors and ranges from - 1 to 1; the standardized adaptation of covariance. By and large, a connection of +/ - 0.7 speaks to a solid connection between two factors. On the other side, connections between - 0.3 and 0.3 show that there is almost no connection between factors.
Probability Distribution Functions
- Probability Density Function (PDF): A capacity for ceaseless data where the incentive anytime can be deciphered as giving a relative probability that the estimation of the irregular variable would rise to that example.
- Probability Mass Function (PMF): A capacity for discrete information that gives the likelihood of a given worth happening.
- Cumulative Density Function (CDF): A capacity that reveals to us the probability that an irregular variable is not exactly a specific worth; the basis of the PDF.
Continuous Data Distributions
- Uniform Distribution: Probability dissemination where all results are similarly likely.
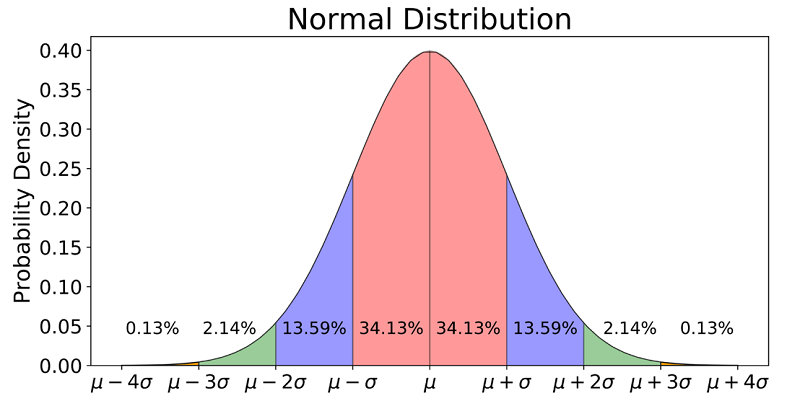
- Normal/Gaussian Distribution: Regularly alluded to as the bell curve and is identified with central limit theorem; has a mean of 0 and a standard deviation of 1.
T-Distribution: Probability dissemination used to evaluate populace parameters when the example size is little and/r when the populace change is obscure.
Chi-Square Distribution: Dissemination of the chi-square measurement.
Discrete Data Distributions
- Poisson Distribution: Probability dissemination that communicates the likelihood of a given number of occasions happening inside a fixed timeframe.
- Binomial Distribution: Probability dissemination of the number of achievements in a succession of n autonomous encounters each with its Boolean-esteemed result (p, 1-p).
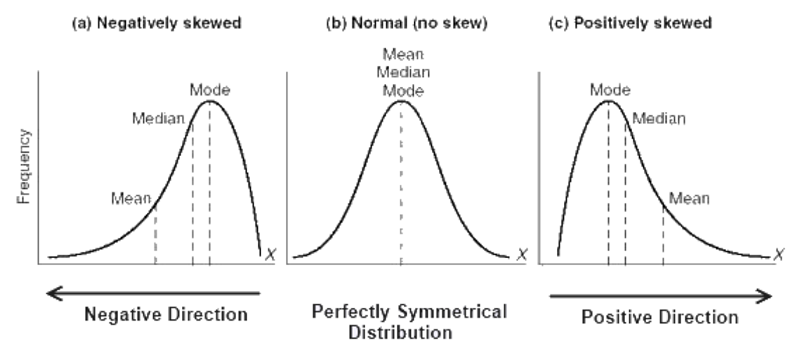
Moments
Moments portray various parts of nature and state of circulation. The principal moment is the mean, the subsequent moment is the fluctuation, the third moment is the skewness, and the fourth moment is the kurtosis.
Probability
Conditional Probability [P(A|B)] is the probability of an occasion happening, in light of the event of a past occasion.
Independent Event whose result doesn't impact the likelihood of the result of another occasion; P(A|B) = P(A).
Mutually Exclusive events are events that can't happen at the same time; P(A|B) = 0.
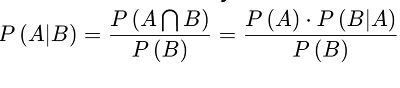
Bayes' Theorem: A scientific recipe for deciding restrictive likelihood. "The probability of A given B is equal to the probability of B given A times the probability of A over the probability of B".
Accuracy
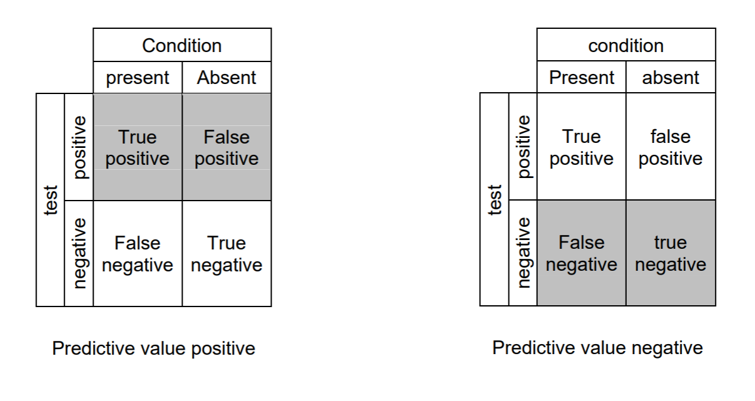
- True positive: Identifies the condition when the condition is available.
- True negative: doesn't distinguish the condition when the condition is absent.
- False-positive: distinguishes the condition when the condition is missing.
- False-negative: doesn't distinguish the condition when the condition is available.
- Sensitivity: otherwise called recall; quantifies the capacity of a test to distinguish the condition when the condition is available; sensitivity = TP/(TP+FN)
- Specificity: quantifies the capacity of a test to accurately reject the condition when the condition is missing; Specificity = TN/(TN+FP)
- Predictive value positive: otherwise called precision; the extent of positives that compare to the nearness of the condition; PVP = TP/(TP+FP)
- Predictive value negative: the extent of negatives that compare to the nonattendance of the condition; PVN = TN/(TN+FN)
Hypothesis Testing and Statistical Significance
- Null Hypothesis: The speculation that example perceptions result absolutely from possibility.
- Alternative Hypothesis: The theory that example perceptions are affected by some non-irregular reason.
- P-value: the likelihood of acquiring the watched aftereffects of a test, accepting that the invalid speculation is right; a littler p-value implies that there is more grounded proof for the elective theory.
- Alpha: The essentialness level; the probability of dismissing the invalid theory when it is valid — otherwise called Type 1 error.
- Beta: type 2 mistake; neglecting to dismiss the false null hypothesis.
Steps to Hypothesis Testing
- Express the invalid and elective theory
- Decide the test size; is it a couple or two-tailed test?
- Register the test measurement and the likelihood value
- Dissect the outcomes and either dismiss or don't dismiss the invalid speculation
Advertisement
Advertisement