Home »
Python »
Python Programs »
Python Matplotlib Programs
How to adjust marker size of scatter plot in Matplotlib?
Matplotlib | Adjust marker size: In this tutorial, we will learn how to adjust the marker size of a scatter plot in Matplotlib using multiple approaches with examples.
By Pranit Sharma Last updated : July 19, 2023
Matplotlib scatter plot
A scatter plot is a graphical representation of the relationship between two data samples. In this plot, the data values are displayed as scattered dots or markers. Matplotlib provides different functions to create and manage scatter plots.
To create a scatter plot, we should follow these steps:
- Prepare the data. Note that data should be continuous.
- Use pyplot.scatter() function to draw scatter plot.
- Add color, legends, and labels if required.
Example
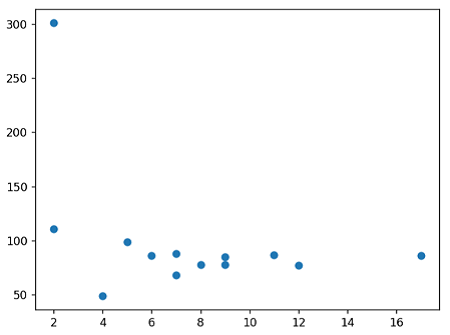
This example shows how to create a scatter plot in Matplotlib.
# Import pyplot module
import matplotlib.pyplot as plt

# Preparing data
x = [5, 7, 8, 7, 2, 17, 2, 9, 4, 11, 12, 9, 6]
y = [99, 68, 78, 88, 111, 86, 301, 78, 49, 87, 77, 85, 86]

# Creating scatter plot
plt.scatter(x, y)

# Display result
plt.show()
The output is -
Adjusting scatter plot marker size
Markers are the dots or points that represents the relationship between the given data samples.

The scatter() function draws a scatter plot with a default size of markers. However, the s parameter is used to control the size of markers of the scatter plot. There is a way of defining the s parameter. we can assign a single integer value to it. It increases/decreases the area of markers and not the diameter.
Note that we can assign an array of different size values to the scatter() function to draw scatter points of different sizes.
Consider the below-given examples to learn the concept of adjusting the marker size of a scatter plot –
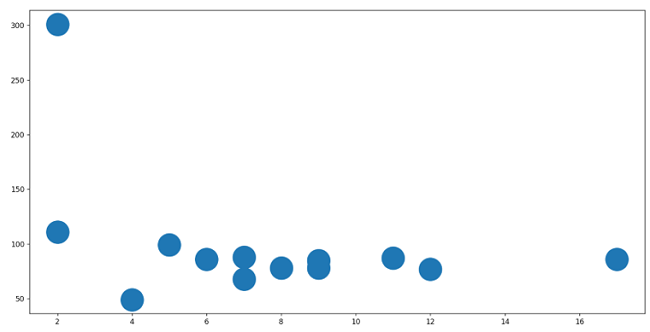
Example 1: Passing a single value for 's'
# Import pyplot module
import matplotlib.pyplot as plt

# Preparing data
x = [5, 7, 8, 7, 2, 17, 2, 9, 4, 11, 12, 9, 6]
y = [99, 68, 78, 88, 111, 86, 301, 78, 49, 87, 77, 85, 86]

# Creating scatter plot
plt.scatter(x, y, s=1000)

# Display result
plt.show()
The output is -
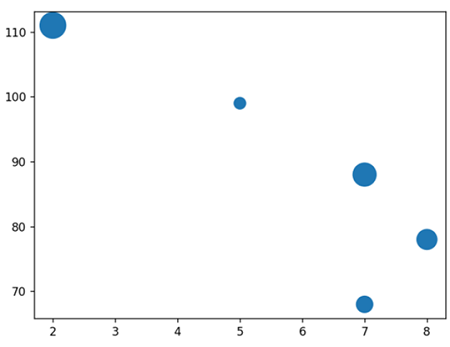
Example 2: Passing multiple values for 's'
# Import pyplot module
import matplotlib.pyplot as plt

# Preparing data
x = [5, 7, 8, 7, 2]
y = [99, 68, 78, 88, 111]

# Creating scatter plot
plt.scatter(x, y, s=[100, 200, 300, 400, 500])

# Display result
plt.show()
The output is -
Advertisement
Advertisement