Home »
Python »
Python Programs »
Python Matplotlib Programs
How to change the subplot size in Matplotlib?
Matplotlib | Change/adjust subplot size: In this tutorial, we will learn to change the subplot size in Matplotlib using multiple approaches with examples.
By Pranit Sharma Last updated : July 19, 2023
Matplotlib subplot
In matplotlib, a graph may contain multiple axes which are known as subplots. In simple words, we can draw a main plot containing multiple subplots representing separate data in matplotlib.
To create subplots, we have to follow these steps:
- Define subplots by using the subplots() function from the pyplot module of matplotlib. This function takes a 2-tuple that represents the dimension of subplots.
- It will return a figure object (fig) and a 2-dimensional NumPy array (ax) for each subplot axes.
- Use the ax array to plot different subplots by giving the index position i.e., the position where the subplot should be created.
Example
Consider the below-given example to learn the concept of creating subplots in Matplotlib:
# Import pyplot module
import matplotlib.pyplot as plt

# Defining subplots
fig, ax = plt.subplots(2, 2)

# Preparing data
x = [10, 20, 30, 40]
y = [100, 200, 300, 400]

# Creating subplots
ax[0, 0].plot(x, y)
ax[0, 1].plot(x, y)
ax[1, 0].plot(x, y)
ax[1, 1].plot(x, y)

# Display result
plt.show()
The output is -
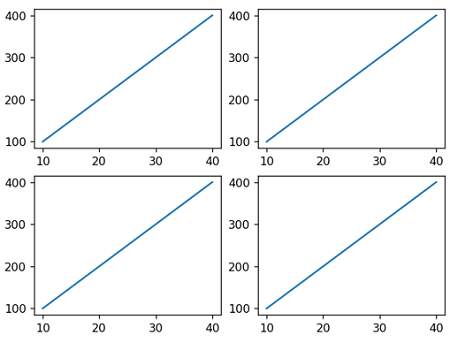
Changing/adjusting subplot size
The size of a subplot depends on different factors like the axes limits, the number of subplots, and the size of the figure. However, we can adjust/change the subplot size by using:
- Using the figsize parameter
- Using the gridspec_kw dictionary
Method 1: Using the figsize parameter
The figsize parameter is passed inside the subplot() function and it is assigned to a 2-tuple which represents the width and height of the subplot.
Example
# Import pyplot module
import matplotlib.pyplot as plt

# Defining subplots
fig, ax = plt.subplots(2, 2, figsize=(10, 8))

# Preparing data
x = [10, 20, 30, 40]
y = [100, 200, 300, 400]

# Creating subplots
ax[0, 0].plot(x, y)
ax[0, 1].plot(x, y)
ax[1, 0].plot(x, y)
ax[1, 1].plot(x, y)

# Display result
plt.show()
The output is -

Explanation: From the above figure, we can observe that the width and height of each subplot are increased to 10 and 8 respectively.
Method 2: Using the gridspec_kw dictionary
The gridspec_kw is a dictionary that is used in pyplot.subplots() function to define the dimensions of the grid for separate subplots. It has predefined keys like width_ratios, height_ratios, etc. If we use width_ratios it must be assigned with an array of values equal to the number of columns.
The first value of the array will set the width of all subplots lying in the first column. The second value of the array will set the width of all the subplots lying in the second column and so on.
Example 1
# Import pyplot module
import matplotlib.pyplot as plt

# Defining subplots
fig, ax = plt.subplots(1, 2, gridspec_kw={"width_ratios": [8, 3]})

# Preparing data
x = [10, 20, 30, 40]
y = [100, 200, 300, 400]

# Creating subplots
ax[0].plot(x, y)
ax[1].plot(x, y)

# Display result
plt.show()
The output is -
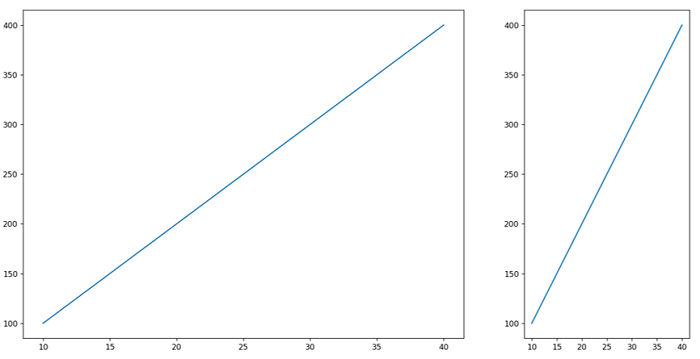
Explanation: In the above plot, we have only two subplots and two columns, the subplot in the first column has a width of 8, and the subplot in the second column has a width of 3.
Example 2
# Import pyplot module
import matplotlib.pyplot as plt

# Defining subplots
fig, ax = plt.subplots(2, 2, gridspec_kw={"width_ratios": [8, 3]})

# Preparing data
x = [10, 20, 30, 40]
y = [100, 200, 300, 400]

# Creating subplots
ax[0, 0].plot(x, y)
ax[0, 1].plot(x, y)
ax[1, 0].plot(x, y)
ax[1, 1].plot(x, y)

# Display result
plt.show()
The output is -

Explanation: In the above figure, we have four subplots and 2 columns, and the subplots lying in the first column have a width of 8, and the subplots lying in the second column have a width of 3.
Advertisement
Advertisement