Home »
Python »
Python Programs
How to plot vectors using matplotlib?
Learn, how to plot vectors in Python using matplotlib?
By Pranit Sharma Last updated : December 23, 2023
NumPy is an abbreviated form of Numerical Python. It is used for different types of scientific operations in python. Numpy is a vast library in python which is used for almost every kind of scientific or mathematical operation. It is itself an array which is a collection of various methods and functions for processing the arrays.
Matplotlib is a library in Python programming language for creating solid visuals and interactive animations for the sake of better analytics of data.
Problem statement
Suppose that we are given a numpy vector/array and we need to plot this vector using matplotlib.
Plot vectors using matplotlib
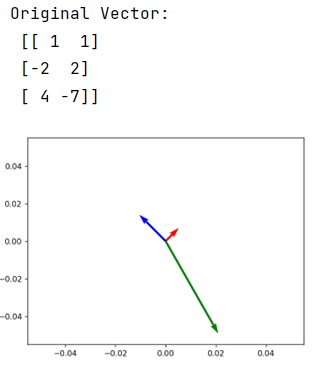
For this purpose, we first need to import matplotlib.pyplot module with the help of which we can simply create a plot of the vector using some origin points. Use the pyplot.quiver() method to plot a 2D field of arrows.
Below is the syntax of the pyplot.quiver() method:
matplotlib.pyplot.quiver(*args, data=None, **kwargs)
Let us understand with the help of an example,
Python code to plot vectors using matplotlib
# Importing numpy
import numpy as np

# Importing matplotlib pyplot
import matplotlib.pyplot as plt

# Creating a vector
vec = np.array([[1,1], [-2,2], [4,-7]])

# Display original vector
print("Original Vector:\n",vec)

# Defining origin points
origin = np.array([[0, 0, 0],[0, 0, 0]])

# Creating a plot
plt.quiver(*origin, vec[:,0], vec[:,1], color=['r','b','g'], scale=21)

# Display plot
plt.show()
Output

Python NumPy Programs »
Advertisement
Advertisement