Home »
Python »
Python Programs
Making Heatmap from Pandas Dataframe
Given a Pandas DataFrame, we have to make heatmap from it.
Submitted by Pranit Sharma, on June 22, 2022
Pandas is a special tool that allows us to perform complex manipulations of data effectively and efficiently. Inside pandas, we mostly deal with a dataset in the form of DataFrame. DataFrames are 2-dimensional data structures in pandas. DataFrames consist of rows, columns, and the data.
Data visualization is a process of representing the data in the form of graphs, plots, and other pictorial formats for better understanding of data and effective analysis of data.
Making Heatmap from Pandas Dataframe
To make a heatmap from pandas DataFrame, use seaborn.heatmap() method, it plots rectangular data as a color-encoded matrix. To use this function, you need to install seaborn library first. The seaborn library is a Python data visualization library that works with the matplotlib and provides a high-level interface for drawing attractive and informative statistical graphics.
Note
To work with pandas, we need to import pandas package first, below is the syntax:
import pandas as pd
To use seaborn, use the following import statement:
import seaborn as sns
Let us understand with the help of an example,
Python program to make heatmap from pandas Dataframe
# Importing pandas package
import pandas as pd

# Importing seaborn as sns
import seaborn as sns

# Creating a dictionary
d = {
    'Ram_Marks':[87,88,82,79,77],
    'Shyam_Marks':[97,78,80,89,74],
    'Seeta_Marks':[50,28,72,69,57],
    'Geeta_Marks':[78,88,28,97,77]
}

# Creating a DataFrame
df = pd.DataFrame(d)

# Creating heapmap
heap = sns.heatmap(df)

# Display heap
print(heap)
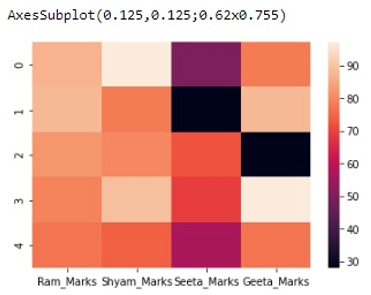
Output
The output of the above program is:
Python Pandas Programs »
Advertisement
Advertisement