Home »
Python »
Python programs
Histogram using Pylab in Python
Here, we are going to learn how to print histogram using Pylab in Python?
Submitted by Anuj Singh, on June 24, 2019
A histogram is a plot which shows the distribution of values in a set of data. The values are sorted first and then divided into classes/group of equal size.
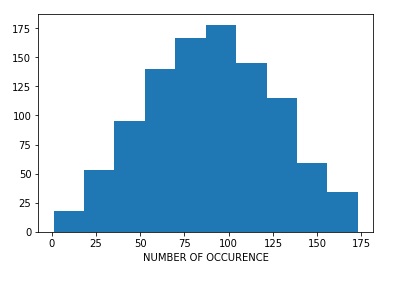
So, in this article, we are going to use hist() function to plot the histogram of the sum of randomly generated numbers.
The function pylab.hist(vals, bin = 10) produces a histogram with 10 equally sized groups and the frequency of result in those classes.
So here is the code:
import random
import pylab
val = []

for n in range(1004):
    x = random.choice(range(0,90))
    y = random.choice(range(0,90))
    val.append(x+y)

pylab.hist(val, bins = 10)
pylab.xlabel('NUMBER OF OCCURENCE')
Output:
Advertisement
Advertisement