Home »
Python »
Python programs
Python program for plotting in same and different graph
In this segment, we are going to take one step further in pylab library to explore how to plot two data in same graph and as well as in different graphs?
Submitted by Anuj Singh, on June 24, 2019
In many cases, we need to compare the data of two different sources visually and then plotting in the same graph will help us out. But when we need to study differently then we must plot them on different graphs.
So here is the code:
import pylab as pl
#PLOTTING IN SAPERATE GRAPH
pl.figure(1)
pl.plot([1,2,3], [1,2,3,])
#PLOTTING IN SAPERATE GRAPH
pl.figure(2)
pl.plot([1,3,2,4], [4,5,6,7])
pl.figure(3)
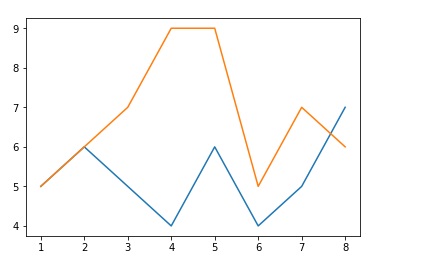
#PLOTTING IN SAME GRAPH
pl.plot([1,2,3,4,5,6,7,8], [5,6,5,4,6,4,5,7])
#PLOTTING IN SAME GRAPH
pl.plot([1,2,3,4,5,6,7,8], [5,6,7,9,9,5,7,6])
Output:

Advertisement
Advertisement