Home »
Python »
Python Programs
How numpy.histogram() function works?
Learn, about the numpy.histogram() function, its usages, and example. How does numpy.histogram() function work?
By Pranit Sharma Last updated : December 25, 2023
NumPy is an abbreviated form of Numerical Python. It is used for different types of scientific operations in python. Numpy is a vast library in python which is used for almost every kind of scientific or mathematical operation. It is itself an array which is a collection of various methods and functions for processing the arrays.
Python - numpy.histogram() Function
numpy.histogram() is used to compute the histogram of a dataset. A histogram is an approximate representation of the distribution of numerical data.
Syntax of numpy.histogram() Function
Below is the Syntax of numpy.histogram() function:
numpy.histogram(a, bins=10, range=None, density=None, weights=None)
It takes a parameter bins that defines the number of equal-width bins in the given range (10, by default). If bins are a sequence, it defines a monotonically increasing array of bin edges, including the rightmost edge, allowing for non-uniform bin widths.
Parameters of numpy.histogram() Function
Below are the list of parameters of numpy.histogram() function:
- a: Input data. The histogram is computed over the flattened array.
- bins: If binsis an int, it defines the number of equal-width bins in the given range (10, by default). If bins is a sequence, it defines a monotonically increasing array of bin edges, including the rightmost edge, allowing for non-uniform bin widths.
- range: The lower and upper range of the bins. If not provided, range is simply (a.min(), a.max()). Values outside the range are ignored. The first element of the range must be less than or equal to the second. rangeaffects the automatic bin computation as well. While bin width is computed to be optimal based on the actual data within range, the bin count will fill the entire range including portions containing no data.
Let us understand with the help of an example,
numpy.histogram() function Examples
Practice the below example to understand the use of numpy.histogram() function:
Example 1: Python program to demonstrate the example of numpy.histogram() function
# Import numpy
import numpy as np
# Creating a numpy array
arr = np.array([1, 2, 1])
# Display original array
print("Original Array:\n", arr, "\n")
# Creating bins
bins = [0, 1, 2, 3]
# Computing histogram
res = np.histogram(arr, bins)
# Display result
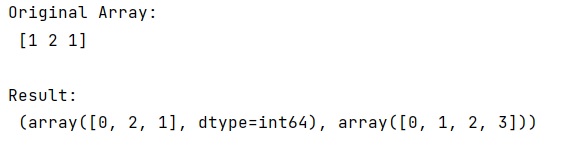
print("Result:\n", res)
Output
Example 2
# Import python numpy library
import numpy as np

# Creating a dataset with random values
arr = np.random.randint(10, size=(20))

# Peinting dataset
print("The dataset (arr):\n", arr)

# Creating a histogram
np.histogram(arr, bins=[0, 1, 2, 3, 4, 5])

# Getting histogram and bins
hist, bins = np.histogram(arr, bins=[0, 1, 2, 3, 4, 5])

# printing histogram
print("hist:\n", hist)
print("bins:\n", bins)
Output
The dataset (arr):
 [6 0 1 7 5 0 2 9 1 0 1 8 6 3 4 5 2 5 8 3]
hist:
 [3 3 2 2 4]
bins:
 [0 1 2 3 4 5]
Python NumPy Programs »
Advertisement
Advertisement