Home »
Python »
Python Programs
Plotting categorical data with pandas and matplotlib
Learn about the Plotting categorical data with pandas and matplotlib in Python.
By Pranit Sharma Last updated : September 23, 2023
One of the important processes of data analysis is data visualisation. Data visualisation is a process of representing the statistical or categorical data in the form of charts, graphs, or any pictorial format.
Data visualisation is an important process as far as data analysis is concerned because it allows us to understand the various kinds of patterns from the data so that we can draw some useful insights from it.
One of the most important libraries for data visualisation is matplotlib, in this article we are going to learn how to plot categorical data with pandas and matplotlib?
Pandas is a special tool that allows us to perform complex manipulations of data effectively and efficiently. Inside pandas, we mostly deal with a dataset in the form of DataFrame. DataFrames are 2-dimensional data structures in pandas. DataFrames consist of rows, columns, and data.
Categorical data
Categorical data is a type of data that has some certain category or characteristic, the value of categorical data is not a single value, rather it consists of classified values, for example, an email can be considered spam or not spam, if we consider 1 as spam and 0 as not spam, we have a classified data in the form of 0 or 1, this is called categorical data.
Note
To work with pandas, we need to import pandas package first, below is the syntax:
import pandas as pd
Let us understand with the help of an example,
Python program to plot categorical data with pandas and matplotlib
# Importing pandas package
import pandas as pd

# Importing matplotlib
import matplotlib as mt

# Creating a DataFrame
df = pd.DataFrame({
    'Year':[2010,2011,2012,2013,2014,2015],
    'Winner':['CSK','CSK','KKR','MI','KKR','MI']
})

# Display DataFrame
print("Created DataFrame:\n",df,"\n")

# Plot the graph
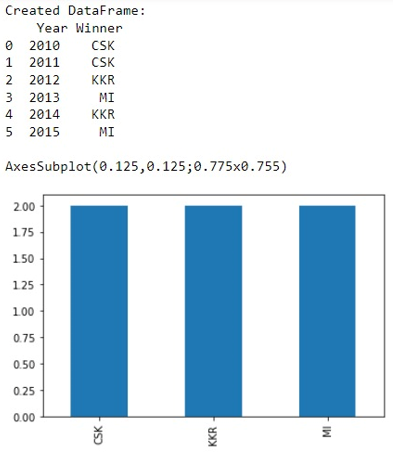
print(df['Winner'].value_counts().plot(kind='bar'))
Output
The output of the above program is:

Python Pandas Programs »
Advertisement
Advertisement