Home »
Python »
Python Programs
Separate bins with vertical lines in histogram
In this tutorial, we will learn how to show separate bins with vertical lines in histogram in Python?
By Pranit Sharma Last updated : May 14, 2023
A histogram is an approximate representation of the distribution of numerical data. The representation is done by grouping the data into bins. Each bin is plotted as a bar whose height corresponds to how many data points are in that bin.
Problem statement
Suppose that we are making a histogram where the bins have the bar style where vertical lines separate each bin, we need to understand what we change in the hist type constructor to get a step-filled histogram.
How to show separate bins with vertical lines in histogram?
To plot a histogram, use matplotlib.pyplot. Once the histogram is created including its bins. Then, you can show the separate bins with vertical lines in the histogram by using the pyplot.xticks() and pyplot.yticks() methods which will set the current tick locations and labels of the x-axis and y-axis.
Let us understand with the help of an example,
Python program to show separate bins with vertical lines in histogram
# Import numpy
import numpy as np

# import matplotlib pyplot
import matplotlib.pyplot as plt

# Creating an array
arr = np.random.rand((20))

# Display original array
print("Original array:\n", arr, "\n")

# Creating bins
bins = np.linspace(0, 2, 20)

# Creating histogram

plt.xlabel("Change in temperature")
plt.ylabel("Hours", fontsize=30)
plt.hist(arr, bins, alpha=0.5, histtype="bar", ec="black")

# Creating vertical lines
plt.legend(loc="upper right", fontsize=30)
plt.xticks(fontsize=20)
plt.yticks(fontsize=20)

# Display histogram
plt.show()
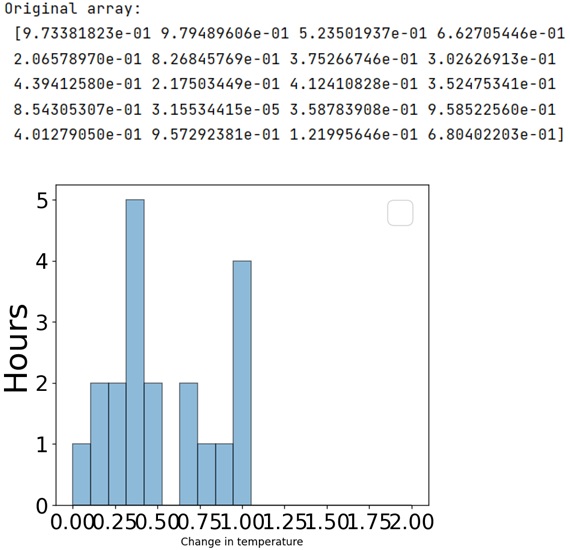
Output
The output of the above program is:
Python NumPy Programs »
Advertisement
Advertisement