Home »
Data Analytics
Data Analytics – Measures of Central Tendency in Data Sets
Learn about the what is central tendency, central tendency in data sets, and measures of central tendency in Data Analytics.
Submitted by IncludeHelp, on February 04, 2022
What is Central Tendency?
When it comes to data sets, the central tendency is a descriptive summary that represents the center point or typical value of a dataset. It is defined as the statistical measure that represents a single value across the entire distribution or dataset. Central tendency is defined as follows: Its goal is to provide a complete and accurate description of all of the data in a distribution.
Central Tendency in Data Sets
These measures indicate the point in a distribution where the majority of the values fall, and they are also referred to as the central location of a distribution. It can be thought of as the tendency of data to cluster around a central value. The mean, median, and mode are the three most commonly used measures of central tendency in statistical analysis. Each of these measures employs a different method for determining the location of the central point in its calculation. Choosing the most appropriate measure of central tendency is dependent on the type of data we have available.
The geometric mean, harmonic mean, midrange, and geometric median are some of the other measures that can be used to define central tendency in addition to the measures listed above. The choice of a central tendency measure is influenced by the characteristics of a given dataset. For example, the mode is the only central tendency measure that can be used with categorical data, whereas the median is the best measure to use with ordinal data.
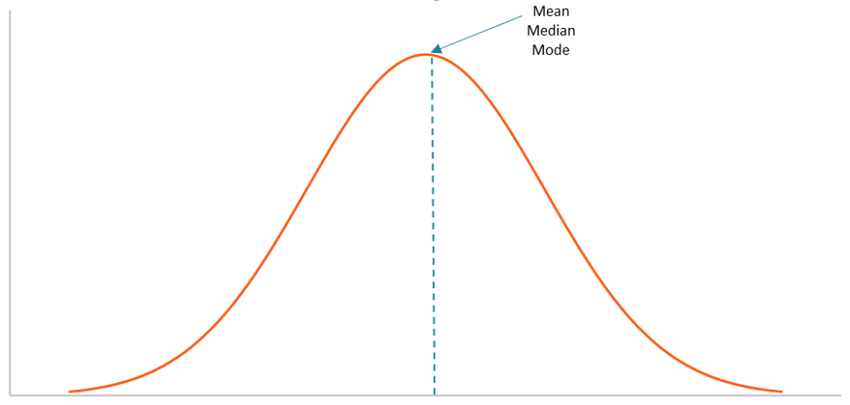
When it comes to quantitative data, the mean is generally considered to be the best measure of central tendency. However, this is not always the case. For example, the mean may not perform well with quantitative datasets that contain values that are either extremely large or extremely small in comparison to one another. The extreme values may cause the mean to be distorted. As a result, you may want to consider other options. Central tendency measures can be calculated using a formula or a defined set of criteria. In addition, they can be identified by looking at a graph of the frequency distribution. It is important to note that for datasets with a normal distribution, the mean, median, and mode are all located in the same location on the graph.
Measures of Central Tendency
The central tendency of the dataset can be found out using the three important measures namely mean, median and mode.
1) Mean
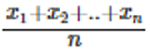
The mean represents the average value of the dataset. It can be calculated as the sum of all the values in the dataset divided by the number of values. In general, it is considered as the arithmetic mean. The formula to calculate the mean value is given as,
2) Median
Median is the middle value of the dataset in which the dataset is arranged in the ascending order or in descending order. When the dataset contains an even number of values, then the median value of the dataset can be found by taking the mean of the middle two values.
3) Mode
The mode represents the frequently occurring value in the dataset. Sometimes the dataset may contain multiple modes and, in some cases, it does not contain any mode at all.
Advertisement
Advertisement