Home »
Data Analytics
Statistics in Data Analytics
Learn what is statistics, logical and financial functions in statistics, statistics for data analytics, etc.
Submitted by IncludeHelp, on April 01, 2022
Any raw data once collected and organized in numerical or table format required analytics to gain insights. Statistics tries to infer the properties of a large collection of data from a sample of the collection, allowing educated guesses to be made with the least amount of money.
Statistics in Data Analytics - Overview
Statistics is the study of gathering data, analyzing it, interpreting it, presenting it, and organizing it in a specific way. Mathematical analysis, linear algebra, stochastic analysis, the theory of measure-theoretical probability, and differential equations are some of the mathematical methods used in various analytics. Statistics is concerned with gathering, classifying, organizing, and displaying numerical data. This enables one to grasp various outcomes from it and foresee a variety of possible outcomes for various events. Statistics are numerical representations of information, observations, and data.
For researchers and professionals from a wide range of disciplines, the ability to analyze and interpret statistical data is a critical skill. You may be required to make decisions based on statistical data, interpret statistical data in research papers, conduct independent research, and interpret the data.
What is Statistics?
Definition 1: "Statistics is the grammar of Science." - Karl Pearson
Definition 2: Statistics is the grammar of "Data" Science. It is most widely used to collect, analyze, present, and interpreting data.
Definition 3: As defined by the American Statistical Association (ASA), "statistics is the scientific study of data collection and analysis, interpretation, presentation, and organization in a specific manner."
There are a wide variety of mathematical techniques that can be applied to various types of analytics. Mathematical analysis, linear algebra, stochastic analysis, measure-theoretical probability theory, and differential equations are just a few of the most popular. The collection, classification, organization, and presentation of numerical data fall under the purview of statistics.
The need to transform the enormous amounts of data available in numerous applied fields into useful information has sparked recent statistical developments. Both theoretical and practical advances have been made in statistics as a result of this.
Every successful data science or analytics executives must adhere good understanding of statistics.
Logical Functions in Statistics
Logical functions are used in data analytics to determine whether a given condition is true or false. We can make a decision about what to do next based on the results of the test. These choices can be used to present results in the form of data or to carry out various calculations.
1. IF
IF function determines whether the specified condition is True or false, it returns True value if the condition is met and False when the condition does not met.
Following example demonstrates if function -
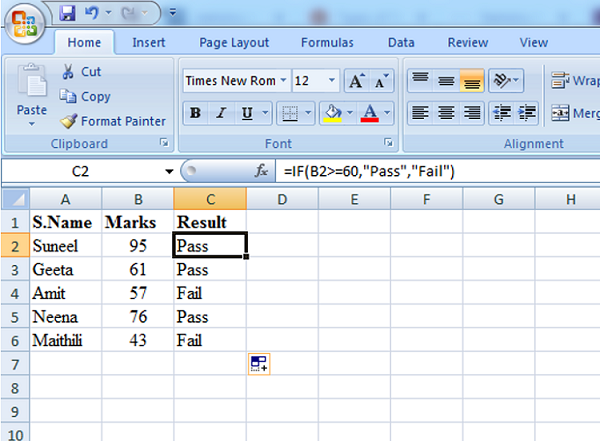
Explanation: in above example, if function has defined in the cell C2. If the score is greater than or equal to 60, the IF function returns Pass, else it returns Fail.
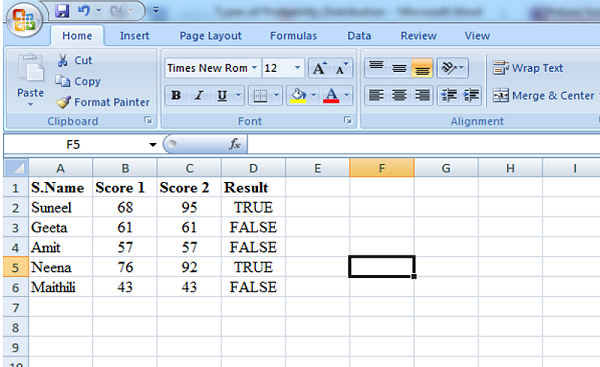
2. AND
The AND Function returns TRUE if all conditions are true and returns FALSE if any of the conditions are false. For example, take a look at the AND function in cell D2 below.
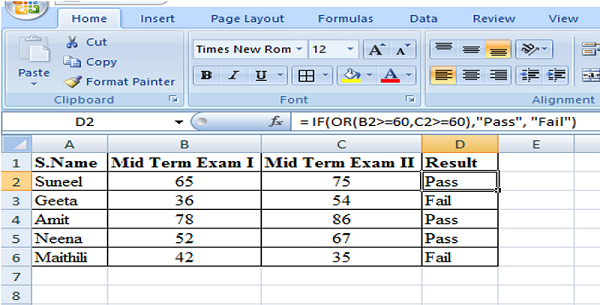
3. OR
The OR Function returns TRUE if any one condition becomes true and returns FALSE if both of the conditions are false. For example, in an institution, two midterm exams conducted for the students and condition was; if a student score greater than or equal to 60 marks in any one midterm then they will be pass otherwise fail.
The below mentioned formula of OR described through an example in the image -
4. NOT
The NOT function in Excel returns the inverse of a logical or Boolean value. NOT returns FALSE when given TRUE. NOT returns TRUE when given FALSE. To reverse a logical value, use the NOT function.
Statistics for Data Analytics
Statistics is important in data science and data analytics because they can be used to derive meaningful insights from data by performing mathematical computations on it. Statistics provides tools and methods for identifying structure and gaining a deeper understanding of data. Data Scientists and Analysts use statistics to process complex problems in the real world so that they can look for meaningful trends and changes in data. To analyze raw data, build a Statistical Model, and infer or predict the result, several statistical functions, principles, and algorithms are used.
Statistics Terminologies in Data Analytics
The most widely used Statistics terminologies in data analytics are as follows –
Population – It's the collection of sources from which data must be gathered. It contains all of the data set's elements. Finite Population, Infinite Population, Existent Population, and Hypothetical Population are the most common types of population.
Sample – It is a subset of the Population
Variable – Any characteristic, number, or quantity that can be measured or counted is referred to as a variable. A data item is another name for a variable.
Advertisement
Advertisement