Home »
Python »
Python Programs
How to save a Seaborn plot into a file?
Given a DataFrame, we have to save a Seaborn plot into a file.
By Pranit Sharma Last updated : September 21, 2023
For statistical graphics or pictorial representation of statistical data, python provides us with a library called seaborn.
This library is closely related to pandas data structure and also it is based upon the concepts of the matplotlib library.
While dealing with a huge amount of data, we may need a good graphical interface to visualize and analyze the data effectively, in that case, we need some python libraries and here the role of seaborn comes into the role.
The seaborn represents our data which is stored in an array, list, or even a complete DataFrame in graphical format for easy understanding.
Here, we are going to understand, how to save a seaborn plot into a file.
Saving a Seaborn plot into a file
To save a seaborn plot into a file, we need to follow 4 easy steps,
First, we need to import the required libraries, then we need to load our data (or we can create a DataFrame manually too). The third step is to create a plot and finally, we will save our plot into a file of the required format (pdf, png, etc.)
Let us understand with the help of an example.
Python code to create dataframe and Seaborn plot and display
# Importing pandas package
import pandas as pd
# Importing matplotlib package
import matplotlib
# Importing seaborn package
import seaborn as sns
# Creating a dictionary
d = {
"Name":['Hari','Mohan','Neeti','Shaily','Ram','Umesh','Shirish','Rashmi','Pradeep','Neelam','Jitendra','Manoj','Rishi'],
"Age":[25,36,26,21,30,33,35,40,39,45,42,39,48],
"Gender":['Male','Male','Female','Female','Male','Male','Male','Female','Male','Female','Male','Male','Male'],
"Profession":['Doctor','Teacher','Singer','Student','Engineer','CA','Cricketer','Teacher','Teacher','Politician',
'Doctor','Manager','Clerk'],
"Title":['Mr','Mr','Ms','Ms','Mr','Mr','Mr','Ms','Mr','Ms','Mr','Mr','Mr'],
"Salary":[200000,50000,500000,0,100000,75000,10000000,50000,50000,200000,200000,150000,15000],
"Location":['Amritsar','Indore','Mumbai','Bhopal','Gurugram','Pune','Banglore','Ranchi','Surat','Chennai','Shimla','Kolkata','Raipur'],
"Marriage Status":[0,1,1,0,1,0,0,1,1,1,0,1,0]
}
# Creating a DataFrame
df = pd.DataFrame(d)
# Creating a plot
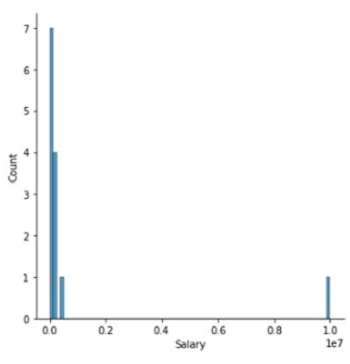
result1 = sns.displot(df['Salary'])
result2 = sns.displot(df['Age'])
# Display result
print(result1)
print(result2)
Output
The output of the above program is:
Salary:
Age:

Until now, we have imported the required libraries, loaded the dataset and created the plot. Now the final step is to save this plot into a file.
For this purpose, we will use plt.savefig() method which will allow us to save the plots into our required format.
Python code to save a Seaborn plot into a file
# Saving the file

# Result 1
result1.savefig('save_as_a_png.png')

# Result 2
result2.savefig('save_as_a_png.png')
There are certain other parameters for the format of the file in which we want to save our file.
Python Pandas Programs »
Advertisement
Advertisement