Home »
Python »
Python Programs
How to Create a Covariance Matrix in Python?
Python Covariance Matrix: In this tutorial, we will learn about the covariance matrix, and how to create a covariance matrix in Python?
By Shivang Yadav Last updated : September 18, 2023
What is covariance matrix in Python?
The covariance matrix is a square matrix that summarizes the covariances between multiple variables in a dataset. It provides valuable information about how different variables in a dataset vary together. Each element in the covariance matrix represents the covariance between two specific variables.
- Positive covariance means they tend to increase or decrease together.
- Negative covariance indicates that they move in opposite directions.
The covariance between two variables X and Y is calculated as follows:
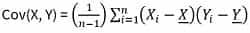
Where,
- Cov(X, Y): Covariance between variables X and Y.
- Xi and Yi: Individual data points.
- X and Y: Means of variables X and Y.
- n: Number of data points.
A covariance matrix is written as a symmetric square matrix where each element represents the covariance. The diagonal elements of the matrix represent the variances of individual variables.
Covariance matrices are frequently used in statistics, data analysis, and machine learning, especially in techniques like Principal Component Analysis (PCA) and linear regression. They help in understanding how variables are related and can be used to make decisions about data dimensionality reduction, feature selection, and other data-related tasks.
Creating a Covariance Matrix in Python
To create/calculate a covariance matrix in Python, we use numpy.cov() method which estimates a covariance matrix based on the given data and weights. Also, set the parameter bias to True.
Python program to create/calculate covariance matrix
# Import NumPy module
import numpy as np

# Creating Data Set in python
score1 = [84, 90, 71, 98, 73, 94, 92, 77, 88, 45]
score2 = [58, 82, 72, 77, 75, 89, 59, 84, 77, 14]
score3 = [97, 94, 93, 95, 88, 82, 78, 84, 69, 78]

dataSet = np.array([score1, score2, score3])
print(f"The values of data set are \n{dataSet}")

# Calculation of Covariance Matrix
covMat = np.cov(dataSet, bias=True)
print(f"The values in Covariance Matrix are \n{covMat}")
Output
The output of the above program is:
The values of data set are
[[84 90 71 98 73 94 92 77 88 45]
 [58 82 72 77 75 89 59 84 77 14]
 [97 94 93 95 88 82 78 84 69 78]]
The values in Covariance Matrix are
[[219.36 226.86  20.94]
 [226.86 421.21  36.14]
 [ 20.94  36.14  75.56]]
Python NumPy Programs »
Advertisement
Advertisement