Home »
Python »
Python Programs
How to add x and y labels to a pandas plot?
Given a Pandas plot, we have to add x and y labels.
By Pranit Sharma Last updated : September 20, 2023
Problem statement
Given a Pandas plot, we have to add x and y labels.
Adding x and y labels to a pandas plot
For this purpose, we will use set_xlabel() and set_ylabel() methods by providing the label names. The set_xlabel() defines/sets the label of the x-axis and the set_ylabel() defines/sets the label of the y-axis. Consider the below-given syntaxes,
set_xlabel('label name')
set_ylabel('label name')
Note
To work with pandas, we need to import pandas package first, below is the syntax:
import pandas as pd
Let us understand with the help of an example.
Python program to add x and y labels to a pandas plot
# Importing pandas package
import pandas as pd
# creating a dictionary
d = {
"Players":['Sachin','Ganguly','Dravid','Yuvraj','Dhoni','Kohli'],
"Runs":[18426,11363,10889,8701,10773,12311]
}
# Now we will create DataFrame
df = pd.DataFrame(d)
# Viewing the DataFrame
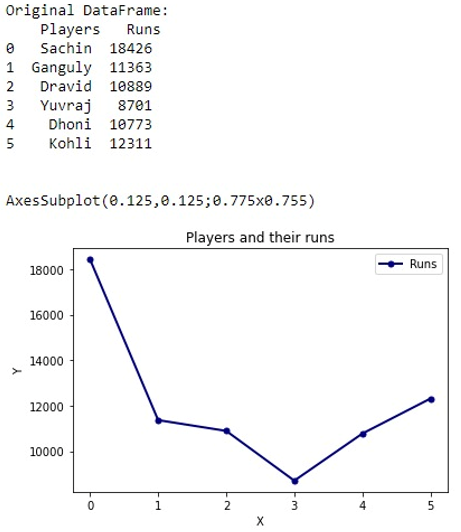
print("Original DataFrame:\n",df,"\n\n")
plot = df.plot(lw=2, colormap='jet', marker='.', markersize=10,
title='Players and their runs')
plot.set_xlabel("X")
plot.set_ylabel("Y")
print(plot)
Output
The output of the above program is:
Python Pandas Programs »
Advertisement
Advertisement