Home »
Python »
Python Data Visualization
Chess Board and Fancy Manipulation in Python using Matplotlib
In this tutorial, we are going to learn how to draw a chess board using a matrix in Python?
Submitted by Anuj Singh, on August 12, 2020
Matplotlib provides an inbuilt function for plotting matrices i.e. matplotlib.pyplot.matshow(). We first define a matrix with entries 0 and 1 using numpy library function numpy.array([]) and then plot it using matplotlib. There are a number of cool manipulations we can do just for fun and experimental purposes.
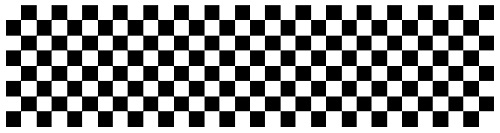
The following plots are a few examples of the chess board and some other manipulations.

Python code for chess board and fancy manipulation using matplotlib
import matplotlib.pyplot as plt
import numpy as np
chess = np.array([[1,0,1,0,1,0,1,0],
[0,1,0,1,0,1,0,1],
[1,0,1,0,1,0,1,0],
[0,1,0,1,0,1,0,1],
[1,0,1,0,1,0,1,0],
[0,1,0,1,0,1,0,1],
[1,0,1,0,1,0,1,0],
[0,1,0,1,0,1,0,1]])
plt.figure(figsize=(10,10))
plt.imshow(chess, cmap='gray')
plt.axis(False)
plt.show()
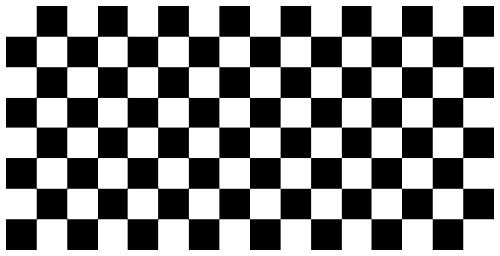
#Chessboard Art
#Example 1
chess = np.array([[1,0,1,0,1,0,1,0, 1,0,1,0,1,0,1,0],
[0,1,0,1,0,1,0,1, 0,1,0,1,0,1,0,1],
[1,0,1,0,1,0,1,0, 1,0,1,0,1,0,1,0],
[0,1,0,1,0,1,0,1, 0,1,0,1,0,1,0,1],
[1,0,1,0,1,0,1,0, 1,0,1,0,1,0,1,0],
[0,1,0,1,0,1,0,1, 0,1,0,1,0,1,0,1],
[1,0,1,0,1,0,1,0, 1,0,1,0,1,0,1,0],
[0,1,0,1,0,1,0,1, 0,1,0,1,0,1,0,1]])
plt.figure(figsize=(10,10))
plt.imshow(chess, cmap='gray')
plt.axis(False)
plt.show()
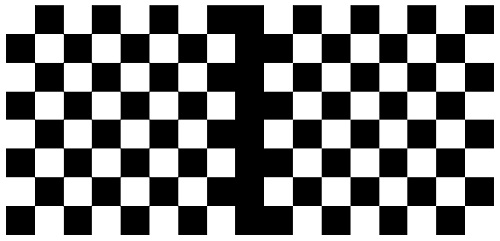
#Example 2
chess = np.array([[1,0,1,0,1,0,1,0, 0, 1,0,1,0,1,0,1,0],
[0,1,0,1,0,1,0,1, 0, 0,1,0,1,0,1,0,1],
[1,0,1,0,1,0,1,0, 0, 1,0,1,0,1,0,1,0],
[0,1,0,1,0,1,0,1, 0, 0,1,0,1,0,1,0,1],
[1,0,1,0,1,0,1,0, 0, 1,0,1,0,1,0,1,0],
[0,1,0,1,0,1,0,1, 0, 0,1,0,1,0,1,0,1],
[1,0,1,0,1,0,1,0, 0, 1,0,1,0,1,0,1,0],
[0,1,0,1,0,1,0,1, 0, 0,1,0,1,0,1,0,1]])
plt.figure(figsize=(10,10))
plt.imshow(chess, cmap='gray')
plt.axis(False)
plt.show()
#Example 3
chess = np.array([[1,0,1,0,1,0,1,0, 1,0,1,0,1,0,1,0, 1,0,1,0,1,0,1,0, 1,0,1,0,1,0,1,0],
[0,1,0,1,0,1,0,1, 0,1,0,1,0,1,0,1, 0,1,0,1,0,1,0,1, 0,1,0,1,0,1,0,1],
[1,0,1,0,1,0,1,0, 1,0,1,0,1,0,1,0, 1,0,1,0,1,0,1,0, 1,0,1,0,1,0,1,0],
[0,1,0,1,0,1,0,1, 0,1,0,1,0,1,0,1, 0,1,0,1,0,1,0,1, 0,1,0,1,0,1,0,1],
[1,0,1,0,1,0,1,0, 1,0,1,0,1,0,1,0, 1,0,1,0,1,0,1,0, 1,0,1,0,1,0,1,0],
[0,1,0,1,0,1,0,1, 0,1,0,1,0,1,0,1, 0,1,0,1,0,1,0,1, 0,1,0,1,0,1,0,1],
[1,0,1,0,1,0,1,0, 1,0,1,0,1,0,1,0, 1,0,1,0,1,0,1,0, 1,0,1,0,1,0,1,0],
[0,1,0,1,0,1,0,1, 0,1,0,1,0,1,0,1, 0,1,0,1,0,1,0,1, 0,1,0,1,0,1,0,1]])
plt.figure(figsize=(10,10))
plt.imshow(chess, cmap='gray')
plt.axis(False)
plt.show()
#Example 3
chess = np.array([[1,0,1,0,1,0,1,0],
[0,1,0,1,0,1,0,0],
[1,0,1,0,1,0,0,0],
[0,1,0,1,0,0,0,0],
[1,0,1,0,0,0,0,0],
[0,1,0,0,0,0,0,0],
[1,0,0,0,0,0,0,0],
[0,0,0,0,0,0,0,0]])
plt.figure(figsize=(10,10))
plt.imshow(chess, cmap='gray')
plt.axis(False)
plt.show()
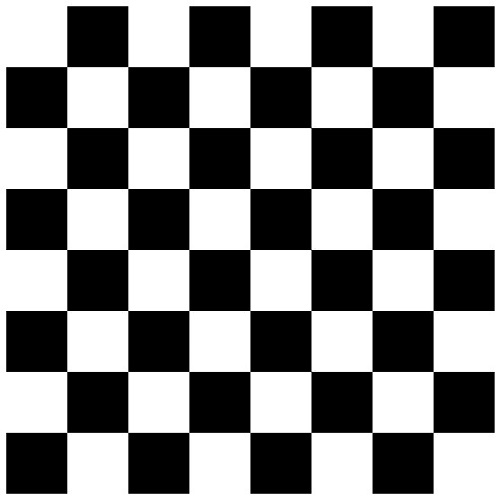
Output:
Output is as Figure
Advertisement
Advertisement