Home »
Python »
Python Data Visualization
Python | Barbs Plot
Barbs Plot in Python with Example: In this tutorial, we will learn about the Barbs Plot and its Python implementation.
By Anuj Singh Last updated : August 18, 2023
Barbs Plot
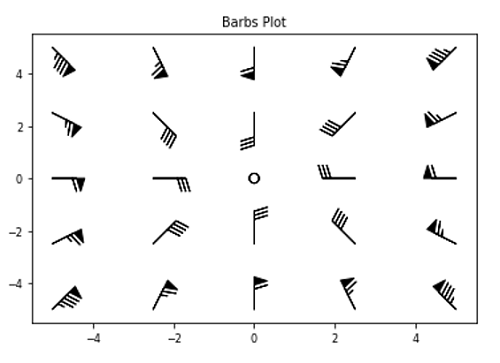
Traditionally, Barbs are used in the meteorological analysis for plotting the direction and speed magnitude of wind observations, Technically they can also be used to plot any two-dimensional vector quantity. As opposed to arrows, which give vector magnitude by the length of the arrow, the barbs give more quantitative information about the vector magnitude by putting slanted lines or a triangle for various increments in magnitude.
Example
The following example show one of the basic Barb-Plot.
Python program to demonstrate example of Barbs Plot
import matplotlib.pyplot as plt
import numpy as np

x = np.linspace(-5, 5, 5)
X, Y = np.meshgrid(x, x)
U, V = 12 * X, 12 * Y

data = [(-1.5, .5, -6, -6),
        (1, -1, -46, 46),
        (-3, -1, 11, -11),
        (1, 1.5, 80, 80),
        (0.5, 0.25, 25, 15),
        (-1.5, -0.5, -5, 40)]

data = np.array(data, dtype=[('x', np.float32), ('y', np.float32),
                             ('u', np.float32), ('v', np.float32)])

plt.barbs(X, Y, U, V)
plt.title('Barbs Plot')
Output:
Output is as Figure
Advertisement
Advertisement