Home »
Python »
Python Data Visualization
Python | Horizontal Grid in Box Plot
Horizontal Grid in Box Plot: In this tutorial, we will learn and explore the grid type in box plot for better data visualization?
By Anuj Singh Last updated : August 18, 2023
Examples
Following example illustrates the implementation of our Grid Plot.
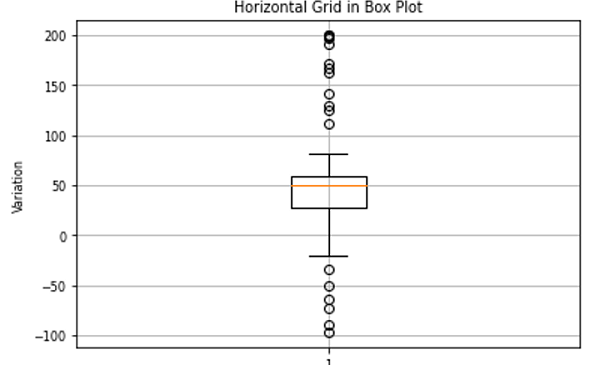
Python program for horizontal grid in box plot
import numpy as np
import matplotlib.pyplot as plt
# Generating Data
spread = np.random.rand(65) * 82
center = np.ones(36) * 50
flier_high = np.random.rand(12) * 100 + 100
flier_low = np.random.rand(10) * -100
data = np.concatenate((spread, center, flier_high, flier_low))
plt.figure()
plt.title('Horizontal Grid in Box Plot')
plt.boxplot(data)
plt.ylabel('Variation')
plt.grid(True)
plt.figure()
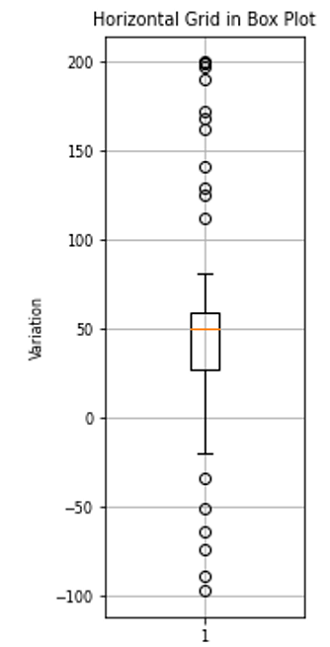
plt.figure(figsize=(2,6))
plt.title('Horizontal Grid in Box Plot')
plt.boxplot(data)
plt.ylabel('Variation')
plt.grid(True)
plt.figure()
Output:
Output is as Figure
Advertisement
Advertisement