Home »
Python »
Python Data Visualization
Horizontal Histogram in Python using Matplotlib
Python | Horizontal Histogram: In this tutorial, we will learn to plot horizontal histogram as a technique used for data visualization.
By Anuj Singh Last updated : August 18, 2023
Histogram
A histogram is a graphical technique or a type of data representation using bars of different heights such that each bar group's numbers into ranges (bins or buckets). Taller the bar higher the data falls in that bin.
Horizontal Histogram
Similar to the conventional histogram, there is a horizontal histogram in which bars are parallel to the x-axis. A Histogram is one of the most used techniques in data visualization and therefore, matplotlib has provided a function matplotlib.pyplot.hist(orientation='horizontal') for plotting horizontal histograms.
Example
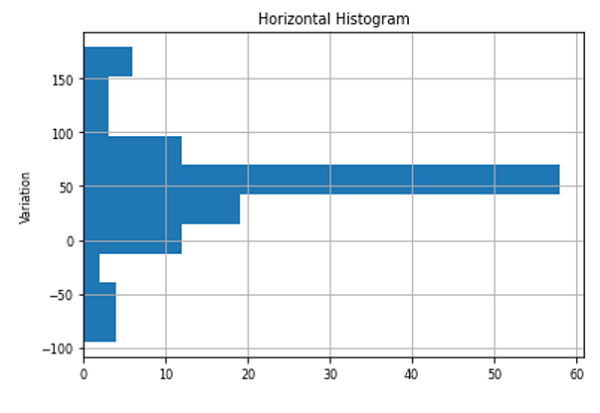
The following example shows an illustration of the horizontal histogram.

>
Python program for horizontal histogram using matplotlib
import numpy as np
import matplotlib.pyplot as plt

# Generating Data
spread = np.random.rand(65) * 82
center = np.ones(36) * 50
flier_high = np.random.rand(12) * 100 + 100
flier_low = np.random.rand(10) * -100
data = np.concatenate((spread, center, flier_high, flier_low))

plt.figure()
plt.title('Horizontal Histogram')
plt.hist(data, orientation='horizontal')
plt.ylabel('Variation')
plt.grid()
plt.figure()
Output
The output of the above program is:
Output is as Figure
Advertisement
Advertisement