Home »
Python »
Python Data Visualization
Python | Horizontal Subplots
Python | Horizontal Subplots: In this tutorial, we will learn how to create multiple subplots using plt.subplots() in Python?
By Anuj Singh Last updated : August 18, 2023
Creating multiple subplots using plt.subplots
Many times while plotting a figure, we have to compare different functions simultaneously. Then we do have the option to plot in a single figure but this is helpful only for a limited number of functions. If there are a greater number of functions, then plotting in the same figure turns out to be messy. Therefore, matplotlib provides a feature of subploting in which we can plot more than one plot in one figure with more than one graph. Subplotting in the horizontal axis is similar to vertical subplotting and is often used for y-axis comparison. We can plot many plots in series and the following are some examples for illustrations.
Code statements to create multiple subplots
#plotting in a one figure
plt.figure()
#leftmost
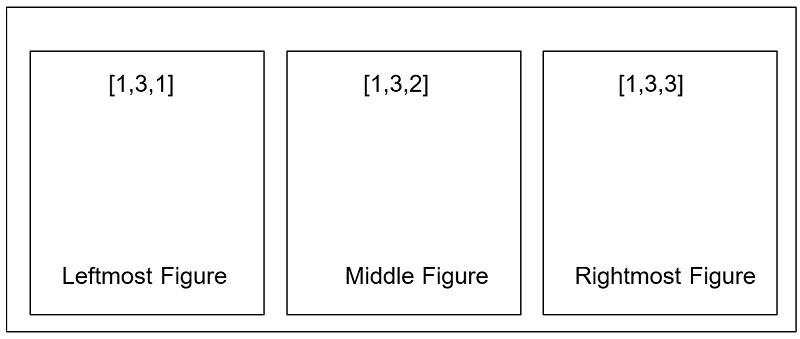
plt.subplot(1, 3, 1)
plt.plot(x1, y1, 'yo')
plt.title('SubPlot Example')
#middle
plt.subplot(1, 3, 2)
plt.plot(x2, y2, 'go')
plt.xlabel('time (s)')
plt.ylabel('Undamped')
#rightmost figure
plt.subplot(1, 3, 3)
plt.plot(x2, y2, 'ro')
plt.xlabel('time (s)')
plt.ylabel('Undamped')
plt.show()

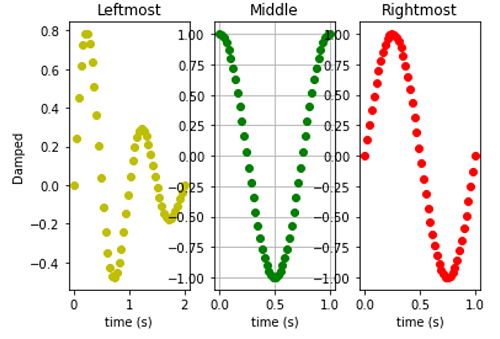
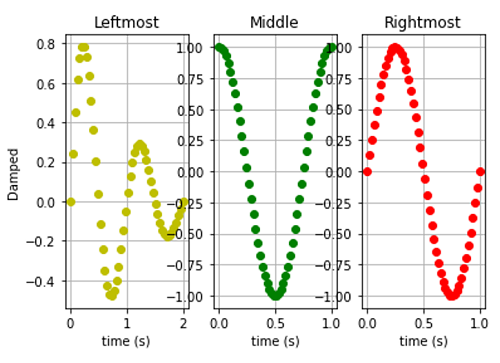
Note: Both the graphs are independent, as the following figure(1) adds grid to one graph and the other remains the same and furthermore in figure(2), both have grid.
Python program for horizontal subplot
# Data Visualization using Python
# Horizontal Subplot

import numpy as np
import matplotlib.pyplot as plt

x1 = np.linspace(0.0, 2.0)
x2 = np.linspace(0.0, 1.0)

y1 = np.sin(2 * np.pi * x1) * np.exp(-x1)
y2 = np.cos(2 * np.pi * x2)
y3 = np.sin(2 * np.pi * x2)

# Example 1 : Default Subplot
plt.figure()
# Leftmost
plt.subplot(1, 3, 1)
plt.plot(x1, y1, 'yo')
plt.title('Leftmost')
plt.ylabel('Damped')
plt.xlabel('time (s)')

# middle
plt.subplot(1, 3, 2)
plt.plot(x2, y2, 'go')
plt.xlabel('time (s)')
plt.title('Middle')

# Rightmost
plt.subplot(1, 3, 3)
plt.plot(x2, y3, 'ro')
plt.xlabel('time (s)')
plt.title('Rightmost')

plt.show()

# Example 2 : Applying Grid to middle subplot
plt.figure()
# Leftmost
plt.subplot(1, 3, 1)
plt.plot(x1, y1, 'yo')
plt.title('Leftmost')
plt.ylabel('Damped')
plt.xlabel('time (s)')

# middle
plt.subplot(1, 3, 2)
plt.plot(x2, y2, 'go')
plt.xlabel('time (s)')
plt.title('Middle')
plt.grid()

# Rightmost
plt.subplot(1, 3, 3)
plt.plot(x2, y3, 'ro')
plt.xlabel('time (s)')
plt.title('Rightmost')

plt.show()

# Example 3 : Applying Grid to All
plt.figure()

# Leftmost
plt.subplot(1, 3, 1)
plt.plot(x1, y1, 'yo')
plt.title('Leftmost')
plt.ylabel('Damped')
plt.xlabel('time (s)')
plt.grid()

# middle
plt.subplot(1, 3, 2)
plt.plot(x2, y2, 'go')
plt.xlabel('time (s)')
plt.title('Middle')
plt.grid()

# Rightmost
plt.subplot(1, 3, 3)
plt.plot(x2, y3, 'ro')
plt.xlabel('time (s)')
plt.title('Rightmost')
plt.grid()
plt.show()
Output:
Output is as figure
Advertisement
Advertisement