Home »
Python »
Python Data Visualization
Python | Controlling the Line Width of a Graph Plot in Matplotlib
Python | Controlling the Line Width of a Graph Plot in Matplotlib: In this tutorial, we will learn how you can change / control the width of the lines in a Matplotlib plot. Learn with the help of example.
By Anuj Singh Last updated : August 18, 2023
Control/Change the Line Width of a Graph Plot in Matplotlib
Line width is another property that can play a big role in basic data visualization. Bold lines have a major impact on readability than thin lines. Plotting includes sum or average line are plotting with greater line width. Because of such type of usage, matplotlib provides a feature to change linewidth.
Syntax
matplotlib.pyplot.plot(x,y,linewidth=2.0)

# linewidth=2.0
# Width of the line
Example
Following is an example for controlling the line width:
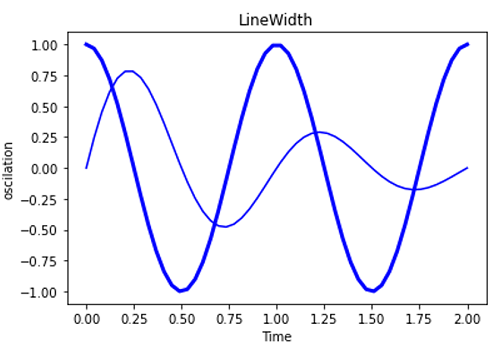
Python program for controlling the line width
# Data Visualization using Python
# Controling line width

import numpy as np
import matplotlib.pyplot as plt

x1 = np.linspace(0.0, 2.0)
x2 = np.linspace(0.0, 2.0)

y1 = np.sin(2 * np.pi * x1) * np.exp(-x1)
y2 = np.cos(2 * np.pi * x2)

plt.plot(x1, y1, 'b')
plt.plot(x2, y2, 'b', linewidth=3.0)
plt.xlabel('Time')
plt.ylabel('oscilation')
plt.title('LineWidth')
plt.figure()
Output:
Output is as figure
Advertisement
Advertisement