Home »
Python »
Python Data Visualization
Change Plot Size in Matplotlib with plt.figsize()
Python | Figure Size of Plot: In this tutorial, we will learn how to change plot size in Matplotlib with plt.figsize() in Python?
By Anuj Singh Last updated : August 18, 2023
Plot Figure Size
In some cases, the automatic figure size generated by the matplotlib.pyplot is not visually good or there could be some non-acceptable ratio in the figure. So, rather than allowing a pyplot to decide the figure size, we can manually define the dimensions of the figure.
Change Plot Size in Matplotlib
To change the plot/figure size of a Matplotlib plot is quite easy, you can use the plt.figsize() method which is an inbuilt method of the Matplotlib library. Consider the below-given syntax:
Syntax
matplotlib.pyplot.figure(figsize)
Example
matplotlib.pyplot.figure(figsize=(9,3))

# figsize(float, float)
    width, height in inches.
1) Wide Figure

2) Tall Plot

3) Small Square Figure
4) Square Figure
Python program for figure size of plot
# Data Visualization using Python
# Figure Size
import numpy as np
import matplotlib.pyplot as plt
x = np.arange(50)
y = 2*x*x + 7*x - 14
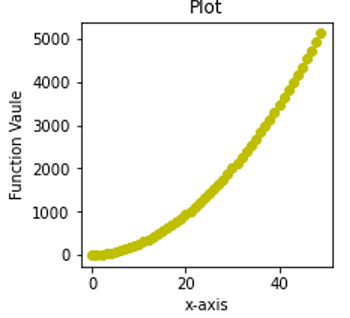
# Example 1
plt.figure(figsize=(9,5))
# Leftmost
plt.plot(x, y, 'yo')
plt.title('Plot')
plt.ylabel('Function Vaule')
plt.xlabel('x-axis')
plt.show()
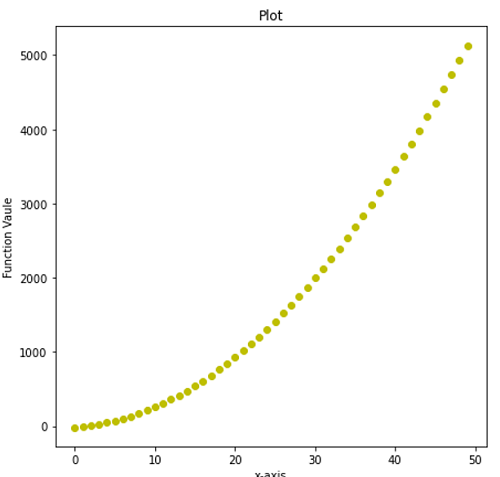
# Example 2
plt.figure(figsize=(6,9))
# Leftmost
plt.plot(x, y, 'yo')
plt.title('Plot')
plt.ylabel('Function Vaule')
plt.xlabel('x-axis')
plt.show()
# Example 3
plt.figure(figsize=(3,3))
# Leftmost
plt.plot(x, y, 'yo')
plt.title('Plot')
plt.ylabel('Function Vaule')
plt.xlabel('x-axis')
plt.show()
# Example 4
plt.figure(figsize=(7,7))
# Leftmost
plt.plot(x, y, 'yo')
plt.title('Plot')
plt.ylabel('Function Vaule')
plt.xlabel('x-axis')
plt.show()
Output:
Output is as figure
Advertisement
Advertisement