Home »
Python »
Python Data Visualization
Python | Categorical Plotting
Python | Categorical Plotting: In this tutorial, we will learn about the categorical plotting and its Python implementation.
By Anuj Singh Last updated : August 18, 2023
Categorical Plotting
Visualizing different variables is also a part of basic plotting. Such variables can have different classes, for example, numerical or a category. Matplotlib has an important feature of Categorical Plotting. We can plot multiple categorical variables within different types of plots such as line, dot, bar, scatter, etc.
Syntax
matplotlib.pyplot.figure(figsize=(4,3))

#figsize(float, float)
width, height in inches.
Examples
Following are some examples of categorical plotting:
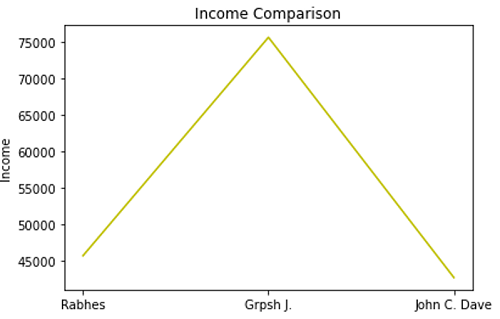
Example 1: Line Plot
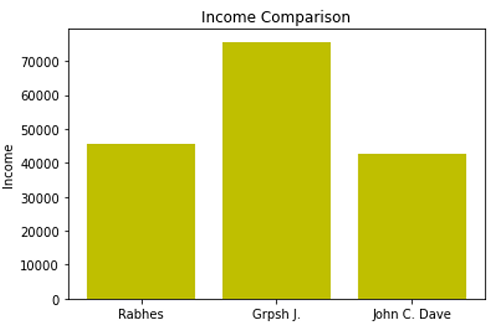
Example 2: Bar Plot
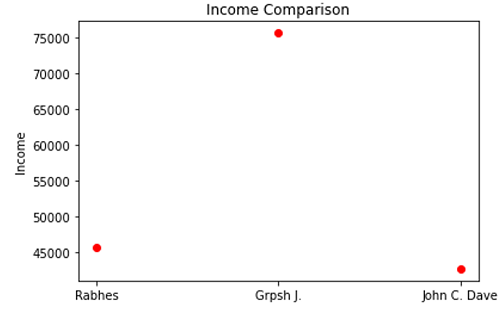
Example 3: Dot Plot
Python program for categorical plotting
# Data Visualization using Python
# Categorical Plotting

import matplotlib.pyplot as plt

names = ['Rabhes', 'Grpsh J.', 'John C. Dave']
values = [45646, 75640, 42645]

# example 1
plt.figure()
plt.plot(names, values, color='y')
plt.ylabel('Income')
plt.title('Income Comparison')
plt.show()

# example 2
plt.figure()
plt.bar(names, values, color='y')
plt.ylabel('Income')
plt.title('Income Comparison')
plt.show()

# example 3
plt.figure()
plt.plot(names, values, 'or')
plt.ylabel('Income')
plt.title('Income Comparison')
plt.show()
Output:
Output is as figure
Advertisement
Advertisement