Home »
Python »
Python Data Visualization
Python | Multiple plots in one Figure
Python | Multiple plots in one Figure: In this tutorial, we are going to learn about the multiple plots in one figure and its Python implementation.
By Anuj Singh Last updated : August 18, 2023
Multiple plots in one Figure
Most of the time, we need to compare multiple data and functions. For better visualization, we prefer plotting them in one figure with different color codes and ultimately it helps in a better understanding of the process variation. Matplotlib.pyplot provides a feature of multiple plotting. The inbuilt function matplotlib.pyplot.plot() allows us to do the same. This is a reasonably good feature and often used.
Syntax
plt.plot(x1,y1,'**',x2,y2,'**',x3,y3,'**')
Parameter(s)
- x1, x2, x3 - x-axis values for different plots,
- y1, y2, y3 - y-axis values for respective plots
- ** - Color and type i.e. **kwargs defined in the library. We can change the color of the dot with replacing r with g for green and y for yellow and there are numbers of colors available in the matplotlib library package.
Application
Multiple plots in the same figure have a huge application in machine learning and day to day visualization. In general mathematics, we can compare two or more different functions, and similarly, we can plot the climate of different cities in the same figure with respect to time.
Examples


Python program to implement multiple plots in one figure
# Data Visualization using Python
# Dot Plot

import matplotlib.pyplot as plt

# plotting using plt.pyplot()
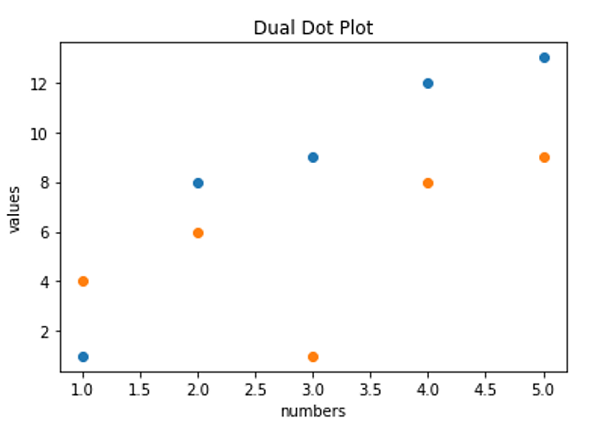
plt.plot([1,2,3,4,5],[1,8,9,12,13],'o',[1,2,3,4,5],[4,6,1,8,9],'o')

# axis labeling
plt.xlabel('numbers')
plt.ylabel('values')

# figure name
plt.title('Dual Dot Plot')

##########################################
plt.figure()
# function for a different figure

# plotting using plt.pyplot() Figure 2
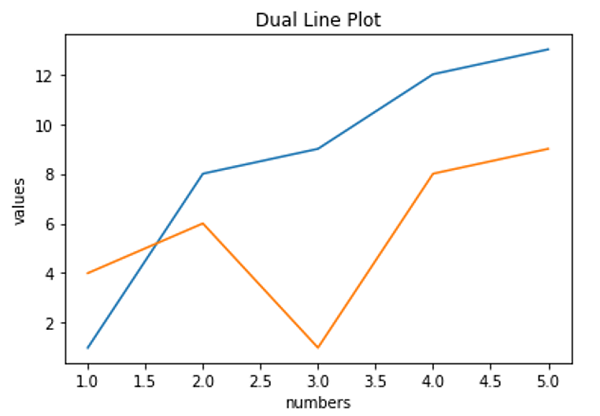
plt.plot([1,2,3,4,5],[1,8,9,12,13],[1,2,3,4,5],[4,6,1,8,9])

# axis labeling
plt.xlabel('numbers')
plt.ylabel('values')

# figure name
plt.title('Dual Line Plot')

##########################################

plt.figure()
# function for a different figure

x = [1,2,3,4,5]

# plotting using plt.pyplot() Figure 2
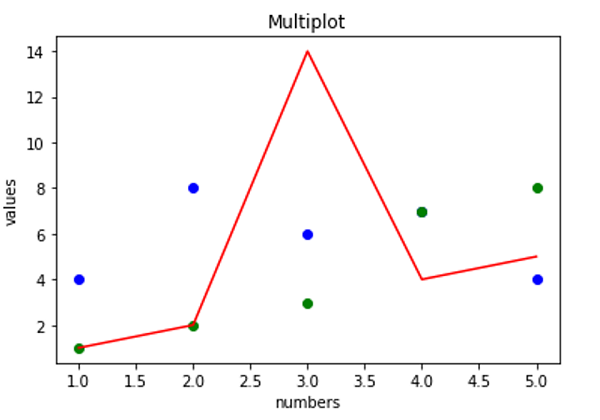
plt.plot(x,[4,8,6,7,4],'bo',x,[1,2,3,7,8],'go',x,[1,2,14,4,5],'r-')

# axis labeling
plt.xlabel('numbers')
plt.ylabel('values')

# figure name
plt.title('Multiplot')
Output:
Output is as figure
Advertisement
Advertisement