Home »
Python »
Python Programs »
Python Matplotlib Programs
How to change the tick frequencies for x or y axis in matplotlib?
In this tutorial, we will learn how to change the tick frequencies for the x or y axis in Matplotlib? Learn with multiple approaches and examples.
By Pranit Sharma Last updated : July 19, 2023
What is "tick frequency" in Matplotlib?
The number of points between two tick marks is known as the tick frequency. Ticks are the marked points on the x and y-axis of the plot. The tick frequency controls how often the tick marks appear on the axes of the plot.
If we do not set a specific tick frequency for the plot, it will generate a default tick frequency based on the dataset passed as input.
Example:
# Import matplotlib pyplot
import matplotlib.pyplot as plt

# Preparing some data
x = [23, 45, 102, 218, 432, 435]
y = [20, 40, 60, 80, 100, 120]

# Creating plot
plt.plot(x, y)
plt.xlabel("x-axis")
plt.ylabel("y-axis")

# Display plot
plt.show()
The output would be –
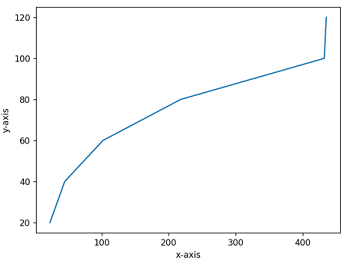
Changing the "tick frequency" on x or y axis in matplotlib
Changing tick frequencies or adjusting the tick spacing in matplotlib is important as it gives us a precise representation of data. Here are some best practices for changing tick frequencies for axes in matplotlib.
- Using matplotlib.pyplot.xticks() method
- Using matplotlib.ticker.MultipleLocator() method
Method 1: Using matplotlib.pyplot.xticks() method
The xticks() function is used to change tick frequency for the x-axis of the plot. We can assign an array of values that we want as the tick intervals. However, yticks() can also be used to change the tick frequencies of the y-axis of the plot.
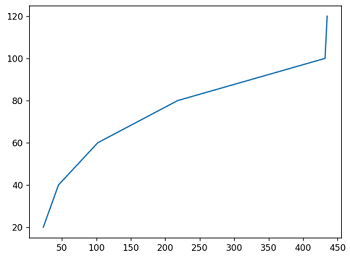
Example
# Import matplotlib pyplot
import matplotlib.pyplot as plt

# Preparing some data
x = [23, 45, 102, 218, 432, 435]
y = [20, 40, 60, 80, 100, 120]

# Creating plot
plt.plot(x, y)
plt.xlabel("x-axis")
plt.ylabel("y-axis")
plt.xticks([20, 120, 220, 320, 420])

# Display plot
plt.show()
The output would be –

Method 2: Using matplotlib.ticker.MultipleLocator() method
Another approach to changing the tick frequencies of axes in matplotlib is to use the MultipleLocator() function from the ticker module. Here are the steps that must be followed:
- Import matplotlib.pyplot
- Create a plot
- To set the frequencies for the x-axis, we use ax.xaxis.set_major_locator inside which we need to call the MultipleLocator() method.
- The MultipleLocator() method accepts input values that represent the tick spacing.
Example
# Import matplotlib pyplot
import matplotlib.pyplot as plt

# Import ticker module
import matplotlib.ticker as ticker

# Preparing some data
x = [23, 45, 102, 218, 432, 435]
y = [20, 40, 60, 80, 100, 120]

# Creating plot
fig, ax = plt.subplots(1, 1)
ax.plot(x, y)

# Define intervals
intervals = 50

# Changing tick frequencies
ax.xaxis.set_major_locator(ticker.MultipleLocator(intervals))

# Display plot
plt.show()
The output would be –
Advertisement
Advertisement