Home »
Python »
Python Programs »
Python Matplotlib Programs
How to save a plot as an image using matplotlib?
Save plot as image with Matplotlib: In this tutorial, we will learn How to save a plot as an image using matplotlib using multiple approaches with the help of examples?
By Pranit Sharma Last updated : July 11, 2023
Matplotlib is an important library of Python programming that allows us to analyze and plot the given data samples for better understanding and fine visualization.
Create plots using Matplotlib
The graphical representation of the data sample is known as the plot in matplotlib. There are different types of plots each of which has a specific purpose and functionalities.
To create a plot with matplotlib, we have to follow a few simple steps:
- Import pyplot module from matplotlib library. This module contains multiple plot types and functionalities.
- Use the plot() function from the matplotlib's pyplot module to create the specified type of plot. This function generally accepts data samples to draw points on the x-axis and y-axis respectively.
- Use the show() function to display the created plot.
Example
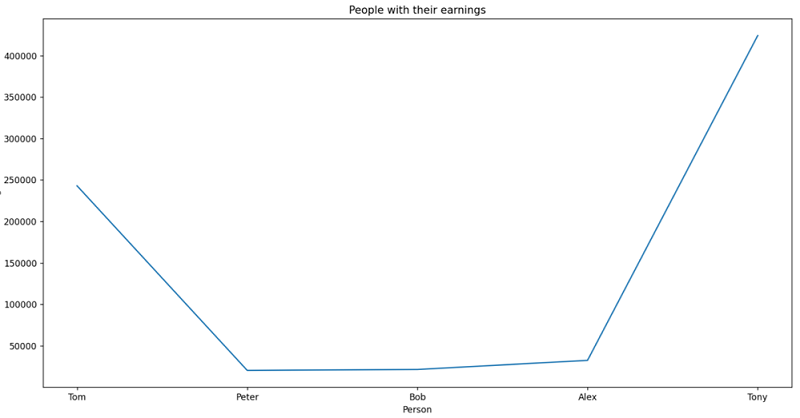
In this example, we are creating and displaying a plot using the matplotlib.
# Importing matplotlib pyplot as plt
from matplotlib import pyplot as plt

# Preparing some dataset
person = ["Tom", "Peter", "Bob", "Alex", "Tony"]
amount = [243000, 20230, 21313, 32343, 424312]

# Creating a line graph with the data set
plt.title("People with their earnings")
plt.xlabel("Person")
plt.ylabel("Earnings")
plt.plot(person, amount)

# Display created plot
plt.show()
Output:
Save a plot as an image using matplotlib
Matplotlib image saving is a widely used technique to save plots as images. Once the plot is created, the main task is to save this plot as an image. You can use two methods/approaches for saving a plot as an image using Matplotlib. They are:
- Using matplotlib savefig() function
- Plot to image conversion using PIL library
Method 1: Using matplotlib savefig() function
To save a plot as an image using Matplotlib, you can savefig() function by specifying the fname parameter to define the path at which the files is being saved along with the file name and extension like ('d:/files/myplot.png'). The savefig() function saves the plotting data as a figure/image on your local machine.
Note that after using the savefig() function, you must use the show() function otherwise a blank file will be saved on the local machine.
Example
In this example, we are creating a plot and then saving it as an image using the savefig() function.
# Importing matplotlib pyplot as plt
from matplotlib import pyplot as plt

# Preparing some dataset
person = ["Tom", "Peter", "Bob", "Alex", "Tony"]
amount = [243000, 20230, 21313, 32343, 424312]

# Creating a line graph with the data set
plt.title("People with their earnings")
plt.xlabel("Person")
plt.ylabel("Earnings")
plt.plot(person, amount)

# Saving the plot as image
plt.savefig("myplot.png")

# Display created plot
plt.show()
Output:

Method 2: Plot to image conversion using PIL library
Another important technique to save the Matplotlib plot as an image is to convert the plot into a PIL image and then save the image. PIL is a Python imaging library that allows us to work with images. Here are the steps that must be followed:
- Import the necessary libraries like matplotlib, PIL, and io.
- To convert the Matplotlib plot into PIL image format, initialize the in-memory buffer.
- Save the buffered image.
- Use the PIL image module to get the image object and store it in a variable.
- Use the save() function on the image object to save the image.
Example
In this example, we are creating a plot and then converting the plotting data as an image using the PIL library.
# Importing matplotlib pyplot as plt
from matplotlib import pyplot as plt

# Import io library
import io

# Import image module from PIL library
from PIL import Image

# Preparing some dataset
person = ["Tom", "Peter", "Bob", "Alex", "Tony"]
amount = [243000, 20230, 21313, 32343, 424312]

# Creating a line graph with the data set
plt.title("People with their earnings")
plt.xlabel("Person")
plt.ylabel("Earnings")
plt.plot(person, amount)

# Getting the current figure
cf = plt.gcf()

# Converting figure to PIL image
buf_img = io.BytesIO()
plt.savefig(buf_img, format="png")

# Getting buffered image
im = Image.open(buf_img)

# Saving image
im.save("myplot2.png")
Output:

Advertisement
Advertisement