Home »
Python »
Python Programs »
Python Matplotlib Programs
How to set axis range/limit (xlim, ylim) in Matplotlib?
Matplotlib | Setting axis limit: In this tutorial, we will learn to set axis range/limit (xlim, ylim) in Matplotlib using multiple approaches with examples.
By Pranit Sharma Last updated : July 19, 2023
Matplotlib is an important library of Python programming language that allows us to represent the given data sets using pictorial and graphical visualizations.
Matplotlib contains a module called pyplot that is responsible to make matplotlib functional. It contains different functions and methods to create, analyze and manage different types of plots.
Matplotlib axis limits
Axis limits are the range of values that a user wants to mark on the x and y axis respectively. These values are the base point to understand the plot and graphs.
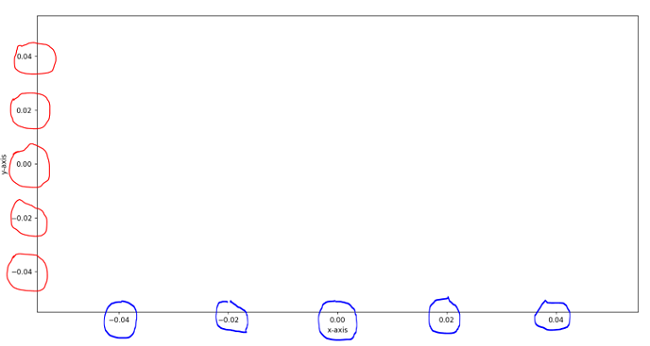
For example, the x and y limits of a plot are represented with blue and red circles in the following figure:
Let us first create a plot and then sets the x and y axis separately. To create a plot, we will use the plot() function over the defined data set.
Create a plot and set the labels of x and y axes
To create a plot you can use the "plot() method, and to set x and y axes labels you can use "xlabel() and "ylabel() method. Consider the below-given example in which we are creating a plot with the given values and setting the both x and y labels:
# Import numpy
import numpy as np

# Import pyplot module
import matplotlib.pyplot as plt

# Preparing some data
x = np.sin([0, 0.5, 1.0, 1.5, 2.0, 2.5, 3.0, 3.5, 4.0, 4.5, 5.0])

# Creating a plot
plt.plot(x)
plt.ylabel("y-axis")
plt.xlabel("x-axis")

# Clear Window
plt.show()
The output is -

In the above figure, we have not defined the limits for either of the axis. Let us set the x and y-axis limits for this plot.
Setting axis range/limit (xlim, ylim) in Matplotlib
To set the axis limits in Matplotlib, you can use:
- matplotlib.pyplot.xlim() for x-axis
- matplotlib.pyplot.ylim() for y-axis
Setting the range/limit of x-axis
To set the range/limit of the x-axis, you can simply use the plot.xlim() method by specifying the minimum and maximum limits. Consider the below-given example in which we are setting the limits for the x-axis:
Example
# Import numpy
import numpy as np

# Import pyplot module
import matplotlib.pyplot as plt

# Preparing some data
x = np.sin([0, 0.5, 1.0, 1.5, 2.0, 2.5, 3.0, 3.5, 4.0, 4.5, 5.0])

# Creating a plot
plt.plot(x)
plt.ylabel("y-axis")
plt.xlabel("x-axis")

# Set x limit
plt.xlim(0, 40)

# Display result
plt.show()
The output is -

We can observe that the plot has squeezed and shifted to the left side. This is because the plot is marked on a very less points while the range of values on x-axis is very high.
Setting the range/limit of y-axis
To set the range/limit of the y-axis, you can simply use the plot.ylim() method by specifying the minimum and maximum limits. Consider the below-given example in which we are setting the limits for the y-axis:
Example
# Import numpy
import numpy as np

# Import pyplot module
import matplotlib.pyplot as plt

# Preparing some data
x = np.sin([0, 0.5, 1.0, 1.5, 2.0, 2.5, 3.0, 3.5, 4.0, 4.5, 5.0])

# Creating a plot
plt.plot(x)
plt.ylabel("y-axis")
plt.xlabel("x-axis")

# Set x limit
plt.ylim(-1, 0)

# Display result
plt.show()
The output is -

In the above figure, we can observe that the plot has expanded along the y-axis. This is because some part of the plot is marked over those points which are not present on the y-axis range.
Advertisement
Advertisement