Home »
Big Data Analytics
Big Data Analytics Life Cycle
Big Data Analytics Life Cycle: In this tutorial, we will learn about the big data analytics lifecycle and its different phases.
By IncludeHelp Last updated : June 13, 2023
Big Data Analytics Lifecycle
Big Data Analytics Lifecycle refers to the process of extracting valuable insights and knowledge from large and complex datasets. It involves several stages, from data collection and storage to analysis and decision-making.
Life Cycle Phases of Data Analytics
Here is an overview of the typical phases involved in the Big Data Analytics Lifecycle:
- Business Case Evaluation
- Data Identification
- Data Acquisition & Filtering
- Data Extraction
- Data Validation & Cleansing
- Data Aggregation & Representation
- Data Analysis
- Data Visualization
- Utilization of Analysis Results
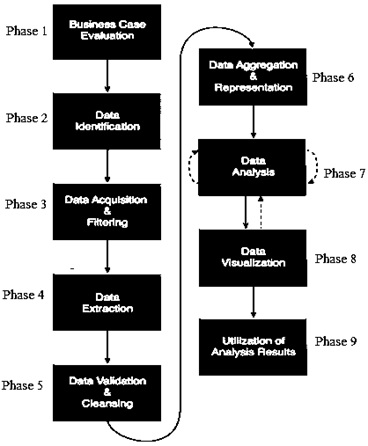
Fig: Big Data Analytics Lifecycle
Phase 1: Business Case Evaluation
Business Case Evaluation is the first phase of the Big Data Analytics lifecycle. It involves assessing the potential value and feasibility of a data analytics project before committing resources to it. Here's a breakdown of the key considerations and steps involved in evaluating a business case in the context of big data analytics:
- Define the problem: Clearly articulate the business problem or opportunity that the analytics project aims to address.
- Set objectives: Establish quantifiable objectives that can be used to evaluate the success of the project.
- Identify stakeholders: Determine business leaders, domain experts, data scientists, IT professionals, and end-users who will involve in the evaluation process.
- Assess data availability: Evaluate the availability and quality of the data required to address the business problem.
Phase 2: Data Identification
Data identification is a process of determining and understanding the data that is available for analysis. Here are the key steps involved in data identification within the big data analytics lifecycle:
- Identify data sources: Determine the potential data sources like structured databases, unstructured data files, external data providers, APIs, social media feeds, and sensor data that may contain the relevant information needed for analysis.
- Assess data quality: Evaluate the quality of the data sources to ensure they meet your requirements.
- Determine data relevance: Assess the data's relevance in terms of the variables, attributes, or features it contains that are required to address the analytics questions.
- Evaluate data availability: Determine if the identified data sources are available and accessible for analysis. Consider any legal or contractual constraints that may affect the use of certain data sources.
- Perform data profiling: Data profiling helps in understanding the data's characteristics and assists in subsequent data pre-processing steps.
Phase 3: Data Acquisition and Filtering
Data acquisition and filtering involve collecting and preparing the relevant data for analysis. Here are the key points involved in Data Acquisition:
- Data Acquisition
- Data Sources: identify potential data sources to analyse data.
- Data collection: Extract the data from the identified sources. This can involve techniques like web scraping, data feeds, data streaming, or direct database queries.
- Data integration: Combine data from multiple sources into a unified dataset. This may involve transforming the data into a common format or resolving inconsistencies.
- Data Filtering:
- Data quality assessment: Evaluate the quality of the acquired data. This involves examining factors like completeness, accuracy, consistency, and relevance.
- Data cleaning: Perform data cleaning operations to handle missing values, outliers, duplicates, and inconsistencies.
- Data reduction: Reduce the dataset size if needed, especially when dealing with large volumes of data.
- Data transformation: Convert the data into a suitable format for analysis.
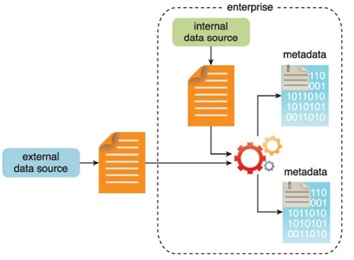
Fig: Metadata is added to data from internal and external sources
Phase 4: Data Extraction
The Data Extraction lifecycle phase is dedicated to extracting disparate data and transforming it into a format that the underlying Big Data solution can use for the purpose of the data analysis.
Example:
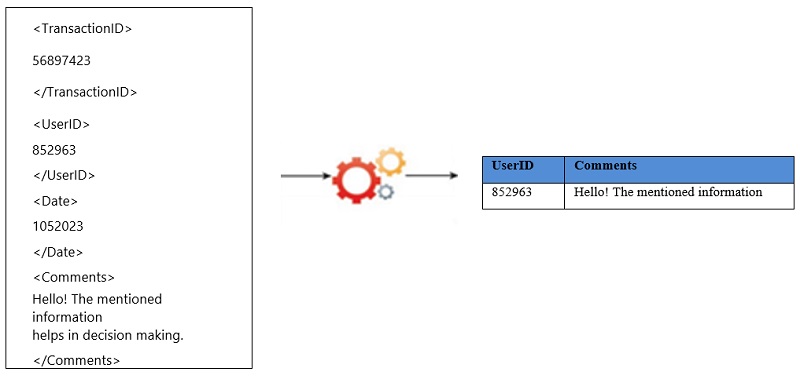
Here are the key points involved in Data Extraction:
- Identify Data Sources: The first step is to identify the relevant data sources that contain the required information for analysis.
- Define Requirements: This includes determining the scope of the data extraction, selecting the data attributes to be extracted, specifying the time period of interest, and establishing any filtering or transformation requirements.
- Choose Extraction Techniques: Depending on the nature of the data sources, different extraction techniques may be employed. For structured databases, SQL queries can be used to extract data based on specific criteria. For unstructured or semi-structured data, web scraping, data parsing, or natural language processing (NLP) may be employed to extract relevant information.
- Implementation: This involves writing scripts or programs to connect to the data sources, retrieve the required data, and apply any necessary transformations or filtering operations.
- Validate and Cleanse Data: This involves performing data quality checks, identifying and handling missing or erroneous data, resolving inconsistencies, and ensuring the data is in a suitable format for analysis.
- Data Storage: After validation and cleansing, the extracted data needs to be stored in a suitable data storage system. This could involve using traditional relational databases, NoSQL databases, data lakes, or data warehouses, depending on the volume, variety, and velocity of the data.
Phase 5: Data Validation and Cleansing
Data validation and cleansing are critical steps in the big data analytics lifecycle. They help ensure the accuracy, consistency, and reliability of the data used for analysis. Here are the key points involved in Data validation and cleansing:
- Data Acquisition: Data validation can involve checking the integrity and completeness of the acquired data to ensure it meets the required quality standards.
- Data Pre-processing: This involves data cleaning, integration, transformation, and reduction.
- Data Storage: Cleaned and pre-processed data is then stored in a suitable data storage system.
- Data Analysis: Once the data is stored, it can be analyzed using various techniques, such as statistical analysis, data mining, machine learning, or visualization.
- Model Development: In this stage, models are developed using the analyzed data to gain insights or make predictions.
- Deployment and Maintenance: Once the models are developed, they are deployed into production environments for real-world use.
Example:
The data validation and cleansing is dedicated to establishing often complex validation rules and removing any known invalid data.
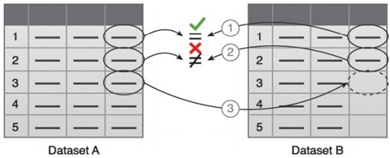
- The first value in Dataset B is validated against its corresponding value in Dataset A.
- The second value in Dataset B is not validated against its corresponding value in Dataset A.
- If a value is missing, it is inserted from Dataset A.
Phase 6: Data Aggregation and Representation
The data aggregation and representation phase is dedicated to integrating multiple datasets to arrive at a unified view. Here are the key points involved in data aggregation and representation:
- Data Aggregation: By effectively aggregating and representing data, organizations can derive valuable insights, and make informed decisions. In the big data analytics lifecycle, data aggregation typically occurs using Data ingestion, data integration, data cleansing, data transformation, and data storage.
- Data Representation: Once the data is aggregated, it needs to be represented in a suitable format using Data Modeling, Dimensional Modeling, Data Visualization, Summary Statistics, and Machine-Readable Formats.
Performing this phase can become complicated because of differences in the:
- Data Structure: Although the data format may be the same, the data model may be different.
- Semantics: A value that is labeled differently in two different datasets may mean the same thing, for example, "surname" and "last name".
Example - Data aggregation where two datasets are aggregated together using the Id field
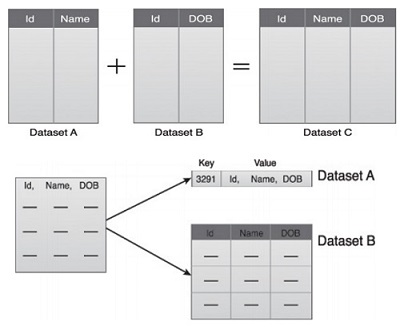
Fig: Dataset A and B can be combined to create a standardized data structure with a big data solution.
Phase 7: Data Analysis
Data analysis is an iterative process that involves extracting meaningful insights from large and complex datasets. The study is repeated until the proper pattern or association is discovered.
Example -
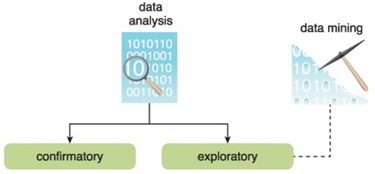
Fig: Data analysis
Here are the key points involved in data analysis:
- Exploratory Data Analysis (EDA): In this phase, analysts perform preliminary data exploration to gain a deeper understanding of the dataset. They do descriptive statistics, data visualization using charts and graphs, pattern recognition, correlations, and outliers.
- Data Transformation and Feature Engineering: This involves creating new features, aggregating data, normalizing, and converting categorical variables into numerical representations.
- Insights and Visualization: After obtaining the final model, analysts interpret the results and extract actionable insights from the data.
- Integration: Once the analysis is complete, the insights and models are integrated into the existing systems to enable decision-making or automate certain tasks.
- Monitoring and Maintenance: Data analysis is an ongoing process and it is essential to continuously monitor the performance of deployed models and maintain their accuracy.
Phase 8: Data Visualization
The Data Visualization phase is dedicated to do the data analysis using data visualization techniques and tools to communicate the analysis results effectively to business users. The outcomes of data visualization provide the ability to perform visual analysis to its users, and allow them to unanswered questions. It helps analysts, data scientists, and business users make sense of the data, identify relationships, and make data-driven decisions.
Here are the key points which show how data visualization fits into the big data analytics lifecycle:
- Data Exploration and Preparation: Once data is acquired, it needs to be explored and prepared for analysis. Data visualization techniques like scatter plots, histograms, and heat maps can be used to gain an initial understanding of the data distribution, identify outliers, and detect patterns. Visualizations can also aid in data cleaning, transformation, and feature engineering tasks.
- Data Modeling and Analysis: Data visualization helps in understanding the output of these models by visually representing the results. For example, decision trees, regression plots, or confusion matrices can be used to interpret and explain the model's behavior and performance.
- Data Visualization and Communication: Data visualization techniques such as charts, graphs, and interactive visualizations help convey complex information in a clear and concise manner. They enable storytelling, presenting key findings, and supporting data-driven recommendations.
- Monitoring and Optimization: Big data analytics is an iterative process, and monitoring the performance of models, data pipelines, or real-time systems is crucial. Visualization tools can provide real-time monitoring dashboards, alerting mechanisms, and visual representations of performance metrics, allowing stakeholders to track the system's health and make necessary optimizations.
- Decision-making and Action: Data visualizations empower decision-makers to understand complex patterns, trends, and dependencies, facilitating effective decision-making. Interactive dashboards can provide self-service analytics capabilities, allowing users to explore data and gain insights on-demand.
Phase 9: Utilization of Analysis Results
In the big data analytics lifecycle, the utilization of analysis results is vital throughout the entire big data analytics lifecycle, from data collection to continuous improvement. It enables organizations to derive insights, make informed decisions, and drive positive outcomes based on data-driven evidence.
Here are the key points which show how the utilization of analysis results fits into the big data analytics lifecycle:
- Data collection: The utilization of analysis results begins here by identifying the relevant data to collect based on the analysis objectives.
- Data pre-processing: The analysis results can be utilized to identify data quality issues, outliers, or missing values that need to be addressed during pre-processing.
- Data analysis: The utilization of analysis results involves interpreting and understanding the patterns, trends, correlations, or anomalies discovered in the data. These insights can be used to gain a deeper understanding of the business problem, identify opportunities, or make data-driven decisions.
- Decision making: The utilization of analysis results is crucial in the decision-making process.
- Performance evaluation: The utilization of analysis results in this stage involves measuring key performance indicators (KPIs), comparing actual outcomes with expected outcomes, and assessing the effectiveness of the decisions made.
- Continuous improvement: The utilization of analysis results is not limited to a single cycle. It is an iterative process that involves continuous improvement. By leveraging past analysis results, organizations can enhance the accuracy, efficiency, and effectiveness of their big data analytics lifecycle.
Advertisement
Advertisement