Home »
Python »
Python Programs
How to use the elbow method in Python to find optimal cluster?
Learn the basics of clustering and finding the optimal cluster using the elbow method in Python.
By Shivang Yadav Last updated : October 26, 2023
In the last article, we learned about K-means clustering and now we will see another method in Python that will allow us to find an optimal cluster. The method is the elbow method.
Elbow Method to Find Optimal Cluster
The elbow method is a popular technique used to determine the optimal number of clusters (K) for K-means clustering. It helps you find the point at which adding more clusters does not significantly improve the model's performance. Here's how it works:
- Run K-means for a Range of K Values: Begining by running the K-means clustering algorithm on the dataset for a range of K values. Typically, one chooses a range of K values from 1 to some maximum value that is sensible for the problem.
-
Compute the Sum of Squared Distances (SSD): For each value of K, calculate the sum of squared distances (SSD) between data points and their assigned cluster centroids. The SSD is a measure of how closely the data points in a cluster are grouped around their centroid. The formula for SSD is:
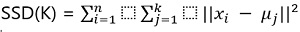
n : number of data points.
k : number of clusters (K).
xi : is a data point.
μi : centroid of cluster j.
- Plotting the Elbow Curve: A line plot can be created to illustrate the relationship between K values (on the x-axis) and the corresponding SSD (on the y-axis). As K increases, the SSD typically decreases, as each cluster becomes smaller and the data points are closer to their centroids. However, beyond a certain point, the reduction in SSD becomes less significant.
- Identify the "Elbow": The optimal number of clusters can be found by looking for the point on the plot where the rate of decrease in the sum of squared distances (SSD) sharply changes, forming an "elbow" shape. This is because, before the elbow, adding more clusters significantly reduces the SSD, but after the elbow, the reduction is minimal.
- Choose K: Select the K value at the elbow point as the optimal number of clusters for your dataset.
Now, lets see the Python program to perform the task,
Python program to find optimal cluster by using the elbow method
import pandas as pand
import numpy as np
#import matplotlib.pyplot as plt
from sklearn.cluster import KMeans
from sklearn.preprocessing import StandardScaler

dataSet = pand.DataFrame({'set1': [18, np.nan, 19, 14, 14, 11, 20, 28, 30, 31, 35, 33, 29, 25, 25, 27, 29, 30, 19, 23],
                   'set2': [3, 3, 4, 5, 4, 7, 8, 7, 6, 9, 12, 14, np.nan, 9, 4, 3, 4, 12, 15, 11],
                   'set3': [15, 14, 14, 10, 8, 14, 13, 9, 5, 4, 11, 6, 5, 5, 3, 8, 12, 7, 6, 5]
                  })


dataSet = dataSet.dropna()
scaled_df = StandardScaler().fit_transform(dataSet)

kmeans_kwargs = {
"init": "random",
"n_init": 10,
"random_state": 1,
}

#create list to hold SSE values for each k
sse = []
for k in range(1, 11):
    kmeans = KMeans(n_clusters=k, **kmeans_kwargs)
    kmeans.fit(scaled_df)
    sse.append(kmeans.inertia_)

#visualize results
# plt.plot(range(1, 11), sse)
# plt.xticks(range(1, 11))
# plt.xlabel("Number of Clusters")
# plt.ylabel("SSE")
# plt.show()


#instantiate the k-means class, using optimal number of clusters
kmeans = KMeans(init="random", n_clusters=3, n_init=10, random_state=1)

#fit k-means algorithm to data
kmeans.fit(scaled_df)

#view cluster assignments for each observation
print(kmeans.labels_)
Output
The output of the above program is:
[1 1 1 1 1 1 2 2 0 0 0 0 2 2 2 0 0 0]
Here, I have commented the map plot line of code in order for it to be compatible with online compilers and compilers with matplotlib library.
Python NumPy Programs »
Advertisement
Advertisement