Home »
Python »
Python Data Visualization
Python | Bar-Line Hybrid Plot
Bar-Line Hybrid Plot in Python. Here, we are going to learn about the Bar-Line Hybrid Plot and its Python implementation.
By Anuj Singh Last updated : August 18, 2023
Bar-Line Hybrid Plot
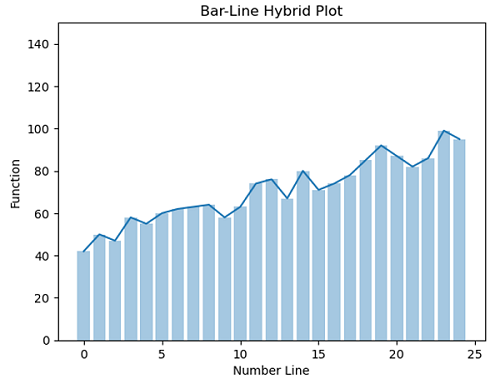
In some of the cases, we need to plot a bar-line hybrid plot. This plot helps in a better understanding of dynamics as well as the relative magnitude of each point in the plot. Bar-Line Hybrid Plots are mostly used for the representation of smaller data sets.
Example
The following example illustrate the implementation and use of the Bar-Line Hybrid Plot.
Python program for bar-line hybrid plot
import numpy as np
import matplotlib.pyplot as plt

x = np.arange(25)
y1 = np.arange(25)
for i in range(25):
    y1[i] = 2*x[i] + np.random.randint(40,56)

plt.figure()
plt.plot(x,y1)
plt.bar(x,y1, alpha=0.4)
plt.ylim(0,150)
plt.xlabel('Number Line')
plt.ylabel('Function')
plt.title('Bar-Line Hybrid Plot')
Output:
Output is as figure
Advertisement
Advertisement