Home »
Python »
Python Data Visualization
Python | Dot-Line Plotting
Python | Dot-Line Plotting: In this tutorial, we are going to learn about the dot-line plotting and its Python implementation.
By Anuj Singh Last updated : August 18, 2023
Dot-Line Plotting
A mixture of dot and line plot is called a Dot-Line plot. Each dot is connected through a line and it is the next version of the line plot. It maintains the discrete property of the points and also represents the correlation between consecutive points. It makes data visualization much better than an individual line or dot plot. Matplotlib provides this feature and with the following examples, we can better understand the implementation.
Standard Dot-Line Plot
Syntax
plt.plot(x, y,'o-')
Parameter(s)
- x - names/numeric distribution
- y - length of the bar
- o- - instruction for dot-line

Dot-Line Plot with Smaller Dot
Syntax
plt.plot(x, y,'o-')
Parameter(s)
- x - names/numeric distribution
- y - length of the bar
- .- - instruction for dot-line with small dot

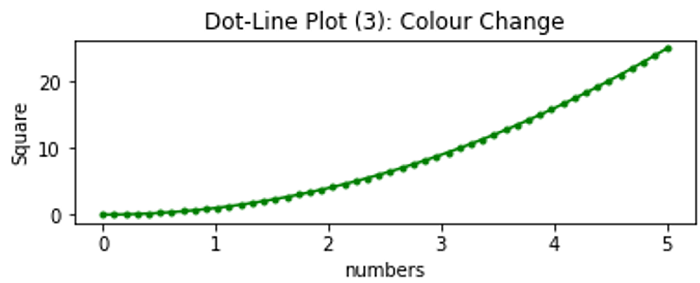
Dot-Line Plot with Different Color
Syntax
plt.plot(x, y,'o-')
Parameter(s)
- x - names/numeric distribution
- y - length of the bar
- g.- - instruction for dot-line with small dot green color
Python program for dot-line plotting
import numpy as np
import matplotlib.pyplot as plt

x = np.linspace(0.0, 5.0)

y = x*x

# default Plot
plt.subplot(2, 1, 1)
plt.plot(x, y, 'o-')
plt.title('Dot-Line Plot (1)')
plt.ylabel('Square')
plt.xlabel('numbers')
plt.show()

# Smaller dot
plt.subplot(2, 1, 2)
plt.plot(x, y, '.-')
plt.title('Dot-Line Plot (2): Smaller Dot')
plt.xlabel('numbers')
plt.ylabel('Square')
plt.show()

#colour Change
plt.subplot(2, 1, 2)
plt.plot(x, y, 'g.-')
plt.title('Dot-Line Plot (3): Colour Change')
plt.xlabel('numbers')
plt.ylabel('Square')
plt.show()
Output:
Output is as figure
Advertisement
Advertisement