Home »
Python »
Python Data Visualization
Python | Dot Plot
Python | Dot Plot: In this tutorial, we are going to learn about the data plot and its implementation with examples.
By Anuj Singh Last updated : August 18, 2023
Dot Plots in Python
The dot plot is a type of data representation in which each data-point in the figure is represented as a dot. Dot plot underlies discrete functions unlike a continuous function in a line plot. Each value could be correlated but cannot be connected. Matplotlib.pyplot provides a feature of dot plots. Dot plots are majorly used in clustering data analysis.
Application
In examples like classifier machine learning algorithms, we often see a dot plot or a scatter plot. It is reasonably good for visualizing clusters using dot plots or scatter plot instead of using line plots.

Syntax
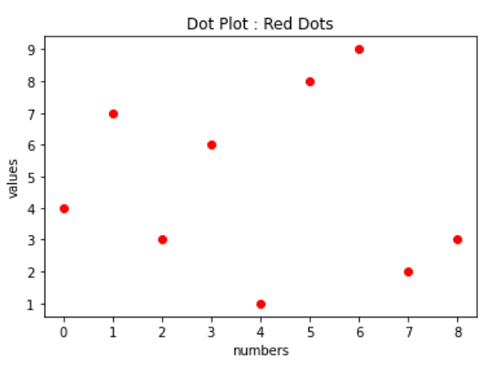
plt.plot([4,7,3,6,1,8,9,2,3], 'ro')
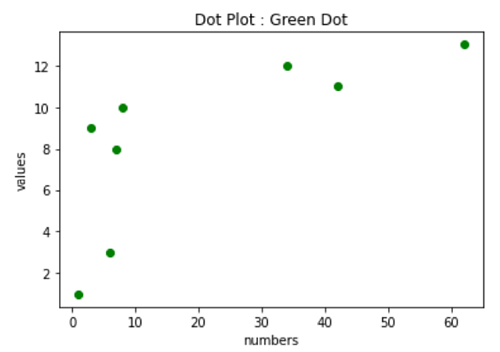
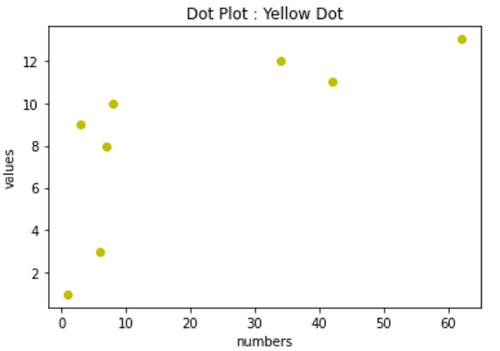
ro - This is the command used for the Red Dot plot. In more words, _o is for dot plot and r_ is for Red. We can change the color of the dot with replacing r with g for green and y for yellow and there are numbers of colors available in the matplotlib library package.


Python program to demonstrate example of dot plot
# Data Visualization using Python
# Dot Plot

import matplotlib.pyplot as plt

# plotting using plt.pyplot()
plt.plot([4,7,3,6,1,8,9,2,3], 'ro')

# axis labeling
plt.xlabel('numbers')
plt.ylabel('values')

# figure name
plt.title('Dot Plot : Red Dots')

##########################################
##########################################

plt.figure()
# function for a different figure

# plotting using plt.pyplot() Figure 2
plt.plot([1,7,3,6,8,42,34,62],[1,8,9,3,10,11,12,13], 'go')

# axis labeling
plt.xlabel('numbers')
plt.ylabel('values')

# figure name
plt.title('Dot Plot : Green Dot')

##########################################
##########################################

plt.figure()
# function for a different figure

# plotting using plt.pyplot() Figure 2
plt.plot([1,7,3,6,8,42,34,62],[1,8,9,3,10,11,12,13], 'yo')

# axis labeling
plt.xlabel('numbers')
plt.ylabel('values')

# figure name
plt.title('Dot Plot : Yellow Dot')
Output
Output is as figure
Advertisement
Advertisement