Home »
Python »
Python Data Visualization
Python | Masked Scatter Plot
Python | Masked Scatter Plot: In this tutorial, we are going to learn how to mask a scatter plot with example?
By Anuj Singh Last updated : August 18, 2023
Masking a scatter plot
Masking a scatter plot refers to differentiating a data point with respect to a function as shown in the following example. It is one of the most important aspects of plotting.
Examples
area1 = np.ma.masked_where(r < r0, area)
area2 = np.ma.masked_where(r >= r0, area)
plt.scatter(x, y, s=area1, marker='^', c=c)
plt.scatter(x, y, s=area2, marker='o', c=c)
Python program for masked scatter plot
import matplotlib.pyplot as plt
import numpy as np
N = 100
r0 = 0.6
x = 0.9 * np.random.rand(N)
y = 0.9 * np.random.rand(N)
area = (20 * np.random.rand(N))**2 # 0 to 10 point radii
c = np.sqrt(area)
r = np.sqrt(x ** 2 + y ** 2)
area1 = np.ma.masked_where(r < r0, area)
area2 = np.ma.masked_where(r >= r0, area)
plt.figure()
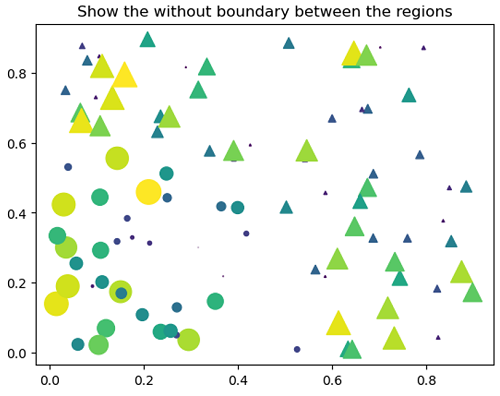
plt.scatter(x, y, s=area1, marker='^', c=c)
plt.scatter(x, y, s=area2, marker='o', c=c)
plt.title('Show the without boundary between the regions')
plt.show()
plt.figure()
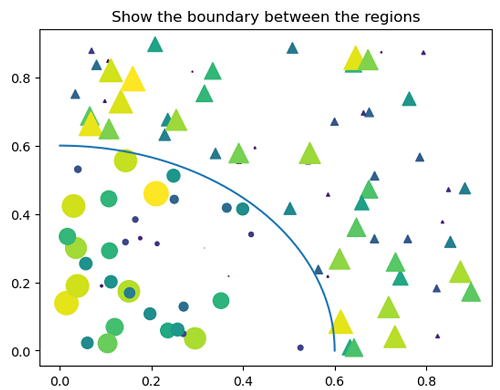
plt.scatter(x, y, s=area1, marker='^', c=c)
plt.scatter(x, y, s=area2, marker='o', c=c)
plt.title('Show the boundary between the regions')
theta = np.arange(0, np.pi / 2, 0.01)
plt.plot(r0 * np.cos(theta), r0 * np.sin(theta))
plt.show()
Output
Output is as figure
Advertisement
Advertisement