Home »
Python »
Python Data Visualization
Python | Plotting Matrix using Color-Maps
Plotting Matrix using Color-Maps in Python: In this tutorial, we will learn about the plotting matrix using color-maps and its Python implementation.
By Anuj Singh Last updated : August 18, 2023
Plotting Matrix using Color-Maps
If we have data in the format of a 2D array (or in the form of a matrix), then we can plot it using an inbuilt matplotlib function matplotlib.pyplot.imshow(). It has a lot of applications and mostly creating heatmaps for data visualization.
In this article, we will review the basic functionality of matrix plotting implementation with a small modification in colormaps. In addition to that, we can manually choose the ticks and label for such plots.
Syntax
plt.imshow(a, alpha=0.8, cmap='YlOrBr_r')
#for tick numbers and labels
plt.xticks( )
plt.yticks( )
We have an option of different color combinations, or said as cmaps as given by the following list.
Available cmap
'Accent', 'Accent_r', 'Blues', 'Blues_r', 'BrBG', 'BrBG_r', 'BuGn', 'BuGn_r',
'BuPu', 'BuPu_r', 'CMRmap', 'CMRmap_r', 'Dark2', 'Dark2_r', 'GnBu', 'GnBu_r',
'Greens', 'Greens_r', 'Greys', 'Greys_r', 'OrRd', 'OrRd_r', 'Oranges',
'Oranges_r', 'PRGn', 'PRGn_r', 'Paired', 'Paired_r', 'Pastel1', 'Pastel1_r',
'Pastel2', 'Pastel2_r', 'PiYG', 'PiYG_r', 'PuBu', 'PuBuGn', 'PuBuGn_r', 'PuBu_r',
'PuOr', 'PuOr_r', 'PuRd', 'PuRd_r', 'Purples', 'Purples_r', 'RdBu', 'RdBu_r',
'RdGy', 'RdGy_r', 'RdPu', 'RdPu_r', 'RdYlBu', 'RdYlBu_r', 'RdYlGn', 'RdYlGn_r',
'Reds', 'Reds_r', 'Set1', 'Set1_r', 'Set2', 'Set2_r', 'Set3', 'Set3_r', 'Spectral',
'Spectral_r', 'Wistia', 'Wistia_r', 'YlGn', 'YlGnBu', 'YlGnBu_r', 'YlGn_r',
'YlOrBr', 'YlOrBr_r', 'YlOrRd', 'YlOrRd_r', 'afmhot', 'afmhot_r', 'autumn',
'autumn_r', 'binary', 'binary_r', 'bone', 'bone_r', 'brg', 'brg_r', 'bwr',
'bwr_r', 'cividis', 'cividis_r', 'cool', 'cool_r', 'coolwarm', 'coolwarm_r',
'copper', 'copper_r', 'cubehelix', 'cubehelix_r', 'flag', 'flag_r', 'gist_earth',
'gist_earth_r', 'gist_gray', 'gist_gray_r', 'gist_heat', 'gist_heat_r', 'gist_ncar',
'gist_ncar_r', 'gist_rainbow', 'gist_rainbow_r', 'gist_stern', 'gist_stern_r',
'gist_yarg', 'gist_yarg_r', 'gnuplot', 'gnuplot2', 'gnuplot2_r', 'gnuplot_r',
'gray', 'gray_r', 'hot', 'hot_r', 'hsv', 'hsv_r', 'inferno', 'inferno_r',
'jet', 'jet_r', 'magma', 'magma_r', 'nipy_spectral', 'nipy_spectral_r',
'ocean', 'ocean_r', 'pink', 'pink_r', 'plasma', 'plasma_r', 'prism', 'prism_r',
'rainbow', 'rainbow_r', 'seismic', 'seismic_r', 'spring', 'spring_r', 'summer',
'summer_r', 'tab10', 'tab10_r', 'tab20', 'tab20_r', 'tab20b', 'tab20b_r', 'tab20c',
'tab20c_r', 'terrain', 'terrain_r', 'twilight', 'twilight_r', 'twilight_shifted',
'twilight_shifted_r', 'viridis', 'viridis_r', 'winter', 'winter_r'
Examples


Python program for plotting matrix using color-maps
import matplotlib.pyplot as plt
import numpy as np
a = np.array([[2,4,2,8], [7,6,8,4], [9,8,7,9], [9,2,3,8], [4,8,8,4], [6,9,7,4]])
[m,n] = np.shape(a)
#Colour Map using Matrix
plt.figure()
plt.imshow(a, alpha=0.8)
plt.xticks(np.arange(n))
plt.yticks(np.arange(m))
plt.xlabel('Numbers')
plt.ylabel('Value')
plt.title('Color Maps')
#Colour Map using Matrix
plt.figure()
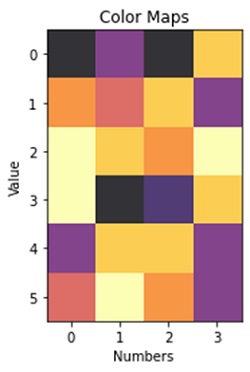
plt.imshow(a, alpha=0.8, cmap='inferno')
plt.xticks(np.arange(n))
plt.yticks(np.arange(m))
plt.xlabel('Numbers')
plt.ylabel('Value')
plt.title('Color Maps')
#Colour Map using Matrix
plt.figure()
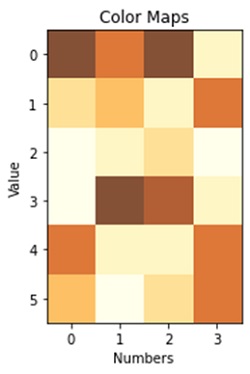
plt.imshow(a, alpha=0.8, cmap='YlOrBr_r')
plt.xticks(np.arange(n))
plt.yticks(np.arange(m))
plt.xlabel('Numbers')
plt.ylabel('Value')
plt.title('Color Maps')
#Colour Map using Matrix
plt.figure()
plt.imshow(a, alpha=0.8, cmap='PiYG_r')
plt.xticks(np.arange(n))
plt.yticks(np.arange(m))
plt.xlabel('Numbers')
plt.ylabel('Value')
plt.title('Color Maps')
#Colour Map using Matrix
plt.figure()
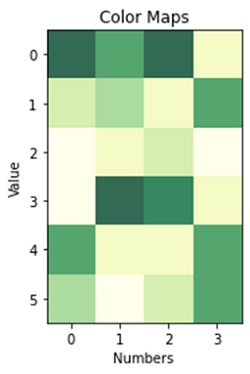
plt.imshow(a, alpha=0.8, cmap='YlGn_r')
plt.xticks(np.arange(n))
plt.yticks(np.arange(m))
plt.xlabel('Numbers')
plt.ylabel('Value')
plt.title('Color Maps')
Output:
Output is as figure
Advertisement
Advertisement