Home »
Python »
Python Data Visualization
Python | Pyplot Labelling (Matplotlib Labels and Title)
Python | Pyplot Labelling: In this tutorial, we are going to learn types of labels in a Pyplot API with the examples.
By Anuj Singh Last updated : August 18, 2023
There are the following types of labels,
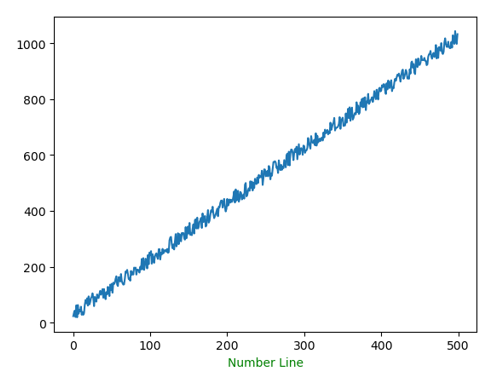
1) X-axis labelling
plt.xlabel('Number Line')
# Default labelling

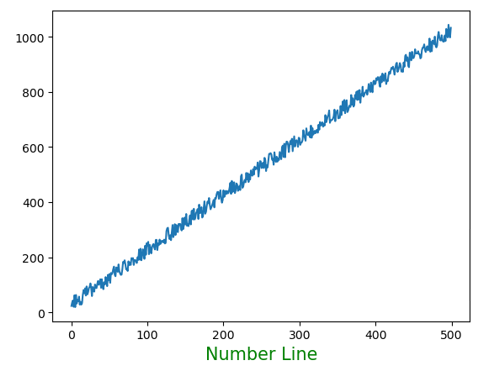
plt.xlabel('Number Line', color='green')
#Font colour Changed
plt.xlabel('Number Line', color='Green', fontsize=15)
#Font size Change
plt.xlabel('Number Line', color='Green', fontsize=15, bbox=dict(facecolor='yellow', alpha=0.5))
#Background Box Addition with opaque ratio

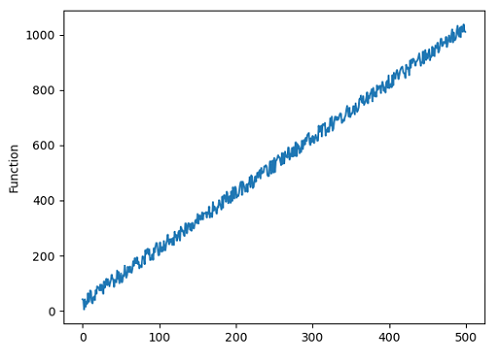
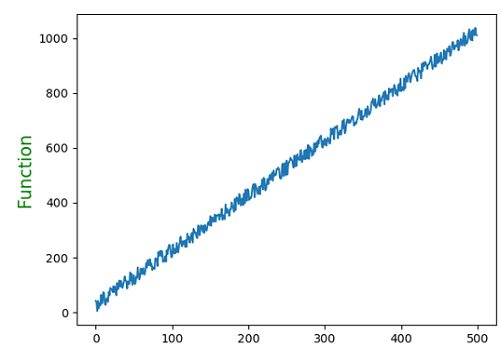
2) Y-axis labelling
plt.ylabel('Function')
#Default Labelling
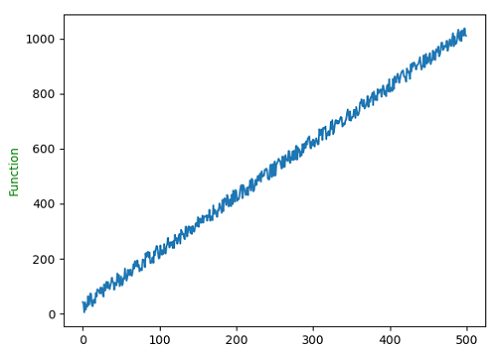
plt.xlabel('Function', color='green')
#Colour Change
plt.xlabel('Function', color='Green', fontsize=15)
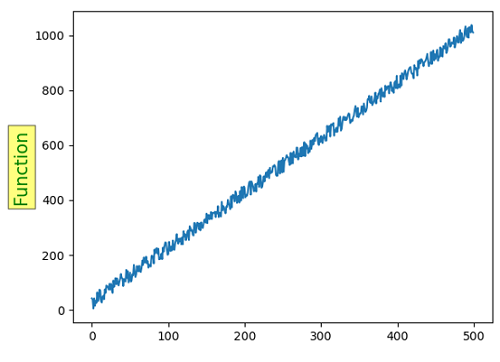
#Font Size Modification
plt.xlabel('Function', color='Green', fontsize=15, bbox=dict(facecolor='yellow', alpha=0.5))
#Background Box Addition with opaque ratio
Pythion program to demonstrate example of pyplot labelling
import numpy as np
import matplotlib.pyplot as plt

x = np.arange(500)
y1 = np.arange(500)
for i in range(500):
    y1[i] = 2*x[i] + np.random.randint(0,56)

#x-axis labelling
#default
plt.figure()
plt.plot(x,y1)
plt.xlabel('Number Line')

#Colour
plt.figure()
plt.plot(x,y1)
plt.xlabel('Number Line', color='green')

#size
plt.figure()
plt.plot(x,y1)
plt.xlabel('Number Line', color='Green', fontsize=15)

#Background Box
plt.figure()
plt.plot(x,y1)
plt.xlabel('Number Line', color='Green', fontsize=15, bbox=dict(facecolor='yellow', alpha=0.5))

#y-axis labelling
#default
plt.figure()
plt.plot(x,y1)
plt.ylabel('Function')

#Colour
plt.figure()
plt.plot(x,y1)
plt.ylabel('Function', color='g')

#size
plt.figure()
plt.plot(x,y1)
plt.ylabel('Function', color='Green', fontsize=15)

#Background Box
plt.figure()
plt.plot(x,y1)
plt.ylabel('Function', color='Green', fontsize=15, bbox=dict(facecolor='yellow', alpha=0.5))
Output:
Output is as figure
Advertisement
Advertisement