Home »
Python »
Python Data Visualization
Python | Streamline Plot
Python | Streamline Plot: In this tutorial, we will learn about the streamline plot and its Python implementation.
By Anuj Singh Last updated : August 18, 2023
Python streamline plot or stream plot
A streamline plot or stream plot (in shorthand) is a type of plotting technique that is specially used to display 2D vector fields. Most of the applications are included in Physics or weather telecasts. When a wind flow is shown on a map is a kind of streamline plotting. Magnetic field lines and electric field lines are shown in our textbooks are the best example of a streamline plot. Following are the key ways by using which we can plot streamline plotting:
pyplot.streamplot() Function
pyplot.streamplot() is an inbuilt function in matplotlib.pyplot which performs our required operation.
Illustrations

Python program for streamline plot
import numpy as np
import matplotlib.pyplot as plt
#building a sample meshgrid
w = 6
Y, X = np.mgrid[-w:w:100j, -w:w:100j]
U = -1 - X**2 + Y
V = 1 + X - Y**2
speed = np.sqrt(U**2 + V**2)
plt.figure()
# Example 1
plt.figure()
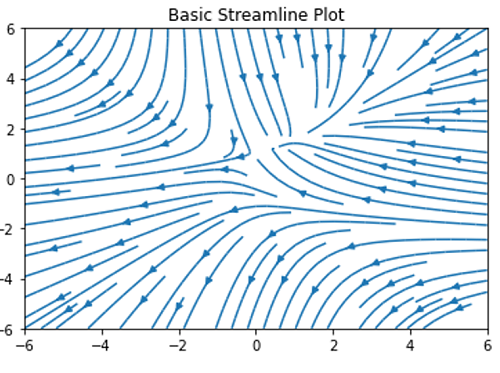
plt.streamplot(X, Y, U, V)
plt.title('Basic Streamline Plot')
# Example 2
plt.figure()
plt.streamplot(X, Y, U, V, linewidth=2.0)
plt.title('Basic Streamline Plot : Linewidth = 2.0')
# Example 3
plt.figure()
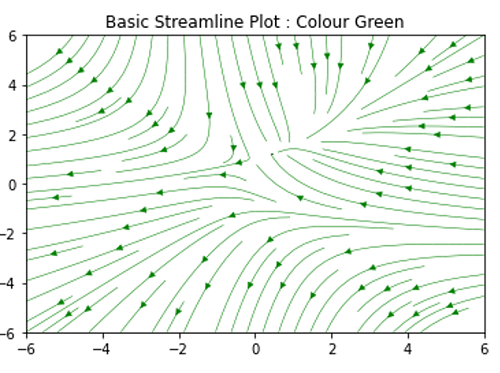
plt.streamplot(X, Y, U, V, color='g', linewidth=0.5)
plt.title('Basic Streamline Plot : Colour Green')
Output:
Output is as Figure
Advertisement
Advertisement