Home »
Python »
Python Data Visualization
Python | Types of Dot in Dot Plot
Python | Types of Dot in Dot Plot: In this tutorial, we are going to learn about the various types of dots in the dot plot with examples.
By Anuj Singh Last updated : August 18, 2023
While comparing the number of plots in a figure, color limits us to very few numbers. Therefore, mathplotlib.pyplot has provided different types of dots (for instance shown in the figure) which allow us to move one step forward in efficacious visualization.
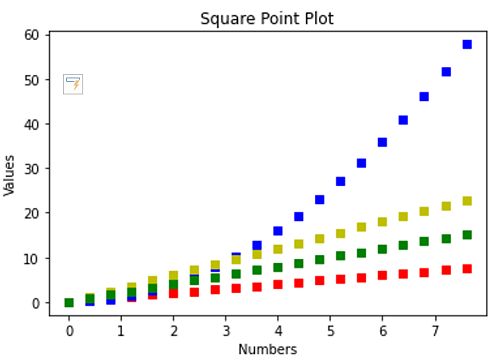
1) Square points with color code Green, Blue, Yellow, Red
Syntax:
plt.plot(x1,y1,'**',x2,y2,'**',x3,y3,'**')
_s - s if keyword for square type points
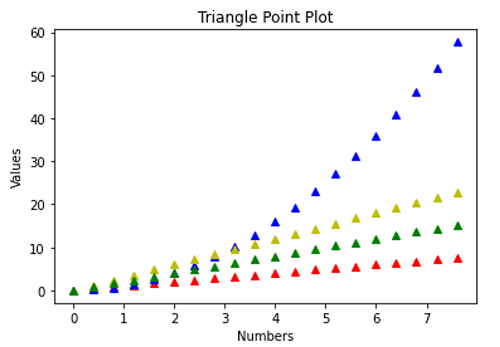
2) Triangle Points with color code Green, Blue, Red, Yellow
Syntax:
plt.plot(x1,y1,'**',x2,y2,'**',x3,y3,'**')
_^ - ^ if keyword for triangle type points
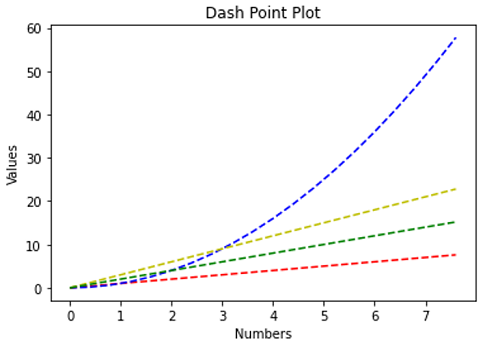
3) Dash Point Plots with color code Green, Red, Blue Yellow
Syntax:
plt.plot(x1,y1,'**',x2,y2,'**',x3,y3,'**')
_-- - -- if keyword for dash type points
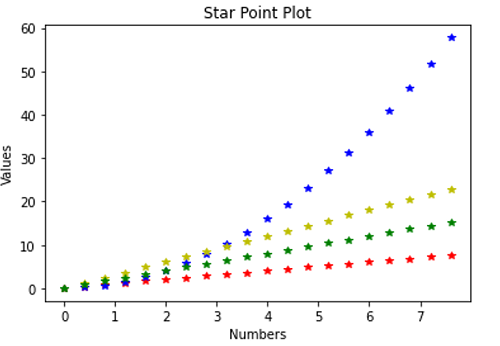
4) Star Point Plot with Color Code Blue, Green, Red, Yellow
Syntax:
plt.plot(x1,y1,'**',x2,y2,'**',x3,y3,'**')
_* - * if keyword for star type points
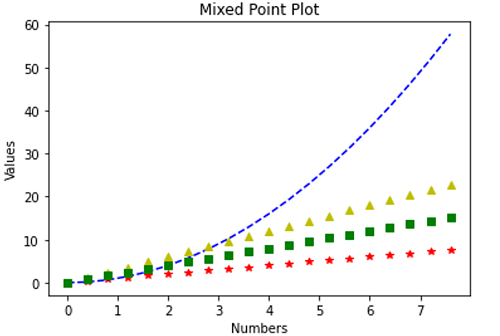
4) Mixed Dot Plots with variation in color
Syntax:
plt.plot(x1,y1,'**',x2,y2,'**',x3,y3,'**')
- x1, x2, x3 - x-axis values for different plots,
- y1, y2, y3 - y-axis values for respective plots
- ** - Colour and type i.e. **kwargs defined in the library. We can change the color of the dot with replacing r with g for green and y for yellow and there are numbers of colors available in the matplotlib library package.
Python code for various types of dot in dot plot
import matplotlib.pyplot as plt
import numpy as np

# evenly sampled time at 200ms intervals
t = np.arange(0, 8, 0.4)

# Figure 1, Square Points
plt.figure()
plt.plot(t, t, 'rs', t, t**2, 'bs', t, t*3, 'ys', t, t+t, 'gs')
plt.xlabel('Numbers')
plt.ylabel('Values')
plt.title('Square Point Plot')
plt.show()

# Figure 2, Triangle Points
plt.figure()
plt.plot(t, t, 'r^', t, t**2, 'b^', t, t*3, 'y^', t, t+t, 'g^')
plt.xlabel('Numbers')
plt.ylabel('Values')
plt.title('Triangle Point Plot')
plt.show()

# Figure 3, Dash Points
plt.figure()
plt.plot(t, t, 'r--', t, t**2, 'b--', t, t*3, 'y--', t, t+t, 'g--')
plt.xlabel('Numbers')
plt.ylabel('Values')
plt.title('Dash Point Plot')
plt.show()

# Figure 4, Star Points
plt.figure()
plt.plot(t, t, 'r*', t, t**2, 'b*', t, t*3, 'y*', t, t+t, 'g*')
plt.xlabel('Numbers')
plt.ylabel('Values')
plt.title('Star Point Plot')
plt.show()

# Figure 5, Combined
plt.figure()
plt.plot(t, t, 'r*', t, t**2, 'b--', t, t*3, 'y^', t, t+t, 'gs')
plt.xlabel('Numbers')
plt.ylabel('Values')
plt.title('Mixed Point Plot')
plt.show()
Output:
Output is as figure
Advertisement
Advertisement