Home »
Python »
Python Data Visualization
Python | Colored Barbs Plot
Colored Barbs Plot in Python: In this tutorial, we are going to learn how to create a contour plot using matplotlib in Python?
By Anuj Singh Last updated : August 18, 2023
Colored Barbs Plot
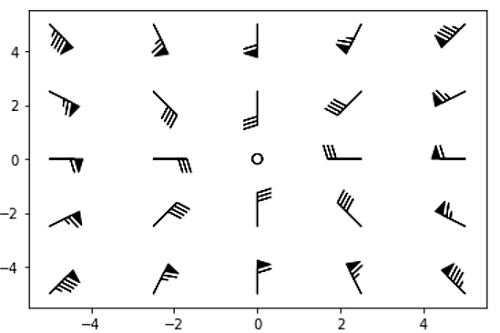
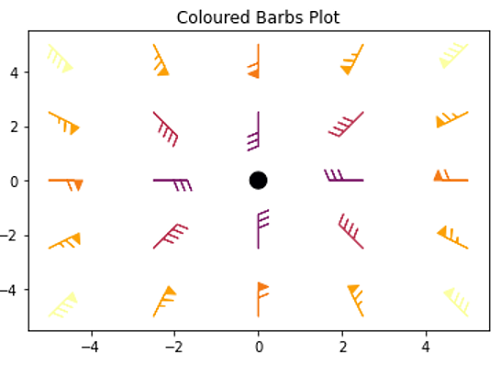
The default barbs plots are black. Adding color will improve visualization and therefore, similar to heatmap and scatter plot, we can add color maps in these barbs plot as well.
Illustrations
The following example illustrates how we can use the object-oriented style in matplotlib for our operation.
Python program for colored barbs plot
import matplotlib.pyplot as plt
import numpy as np
x = np.linspace(-5, 5, 5)
X, Y = np.meshgrid(x, x)
U, V = 12 * X, 12 * Y
data = [(-1.5, .5, -6, -6),
(1, -1, -46, 46),
(-3, -1, 11, -11),
(1, 1.5, 80, 80),
(0.5, 0.25, 25, 15),
(-1.5, -0.5, -5, 40)]
data = np.array(data, dtype=[('x', np.float32), ('y', np.float32),('u', np.float32), ('v', np.float32)])
fig, ax = plt.subplots()
ax.barbs(X,Y,U,V)
plt.show()
ax.set_title('Default Barbs Plot')
fig, ax = plt.subplots()
plt.inferno()
ax.barbs(X, Y, U, V, np.sqrt(U ** 2 + V ** 2), fill_empty=True,
rounding=False,
sizes=dict(emptybarb=0.25,
spacing=0.2, height=0.3))
ax.set_title('Coloured Barbs Plot')
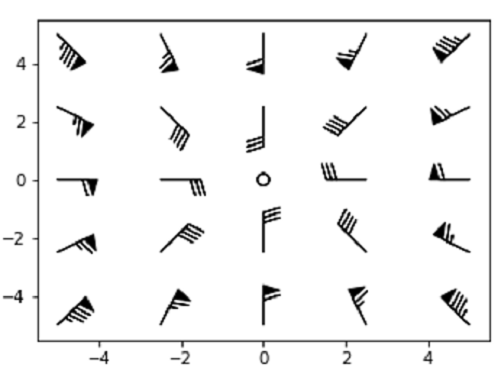
fig1, axs1 = plt.subplots(nrows=2, figsize=(5,8))
axs1[0].barbs(X, Y, U, V)
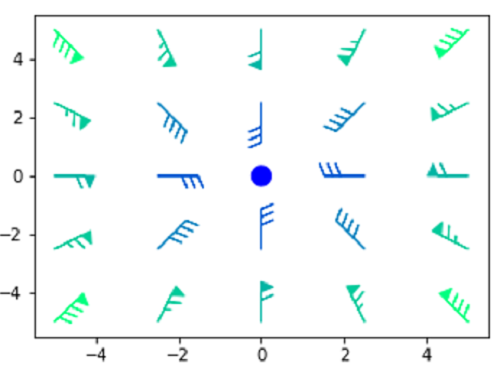
plt.winter()
axs1[1].barbs(
X, Y, U, V, np.sqrt(U ** 2 + V ** 2), fill_empty=True, rounding=False,
sizes=dict(emptybarb=0.25, spacing=0.2, height=0.3))
plt.show()
Output:
Output is as Figure
Advertisement
Advertisement