Home »
Python »
Python Data Visualization
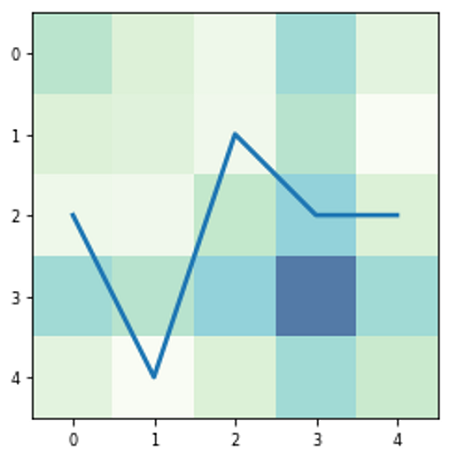
Python | Hybrid Line Plot with Heatmap
Hybrid Line Plot with Heatmap: In this tutorial, we are going to learn how to draw a line plot with a heatmap in the background for better data visualization?
By Anuj Singh Last updated : August 18, 2023
Example
Following example illustrates the implementation of our desired plot.

Python program for hybrid line plot with heatmap
import numpy as np
import matplotlib.pyplot as plt

x = np.arange(5)
y = np.random.randint(1,5,5)
mata = np.random.random([5,4])
mataa = np.matmul(mata, mata.T)
plt.imshow(mataa, cmap='GnBu', alpha=0.7)
plt.plot(x,y, linewidth=2.5)
plt.axis(False)
plt.show()

plt.figure()
mata = np.random.random([5,4])
mataa = np.matmul(mata, mata.T)
plt.imshow(mataa, cmap='GnBu', alpha=0.7)
plt.plot(x,y, linewidth=2.5)
plt.show()
Output:
Output is as Figure
Advertisement
Advertisement