Home »
Python »
Python Data Visualization
Python | Bar Plot vs Pie Plot
Bar Plot vs Pie Plot in Python: In this tutorial, we are going to compare Pie Plot and Bar Plot in terms of visualization.
By Anuj Singh Last updated : August 18, 2023
Bar Plot vs Pie Plot
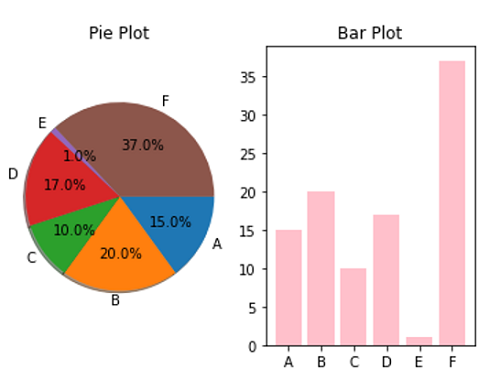
We used Subplot for side by side plot comparison. This would help us to decide which plotting technique should be used for any desired application.
Bar Plot
When we have to compare multiple categories but the sum is not 100, then it is good to use Bar Plot.
Pie Plot
When the data to be summed up to 100 Percent then it is preferable to use Pie Plot.
Illustration
Python program to demonstrate example to compare bar plot and pie plot
import matplotlib.pyplot as plt
labels = 'A', 'B', 'C', 'D', 'E', 'F'
sizes = [15, 20, 10, 17, 1, 37]
alp = (0.9, 0.9, 0.9, 0, 0.9, 0.9)
plt.figure()
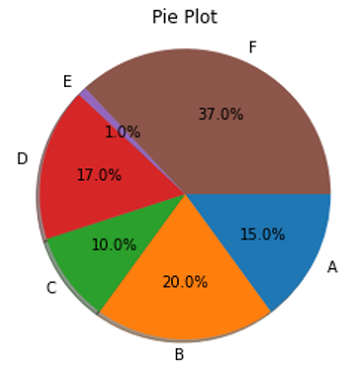
plt.title('Pie Plot')
plt.pie(sizes, labels=labels, counterclock=False, autopct='%1.1f%%', shadow=True)
plt.axis('equal')
plt.show()
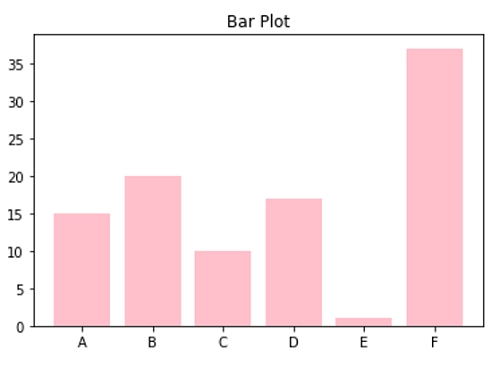
plt.figure()
plt.title('Bar Plot')
plt.bar(labels, sizes, color='pink')
plt.show()
plt.figure()
plt.subplot(121)
plt.title('Pie Plot')
plt.pie(sizes, labels=labels, counterclock=False, autopct='%1.1f%%', shadow=True)
plt.axis('equal')
plt.subplot(122)
plt.title('Bar Plot')
plt.bar(labels, sizes, color='pink')
plt.show()
Output:
Output is as figure
Advertisement
Advertisement