Home »
Machine Learning/Artificial Intelligence
Kendall's Tau Correlation Implementation using Python
In this tutorial, we will learn about the Kendall's Tau correlation, and its implementation using Python.
By Raunak Goswami Last updated : April 16, 2023
What is Kendall's Tau Correlation?
As the name suggests this correlation was named after Maurice Kendall in the year 1938. The Kendall's Tau Correlation is best suited for the discrete data. Here we are not completely dependent on the directional flow of the ranks of various observation that we used to do in Spearman's correlation. Here we are more concerned with concordant pairs and discordant pairs.
1. Concordant pairs
For a given set of data the concordant pairs are such that for a given set of data suppose (x1, y1) and (x2, y2) then x1<x2 and y1<y2 where x1 and x2 can be any of the attribute values and y1 and y2 are the values in the target column.
2. Discordant pairs
For a given set of data, the discordant pairs would be the pairs which do not satisfy the property of the concordant pairs which is x1<x2 and y1<y2. Where x1 and x2 can be any of the attribute values and y1 and y2 are the values in the target column.
After calculating concordant and discordant pairs we find the difference between them and then divide the result by the number of possible combinations of the different pairs. The main aim of dividing the difference by the number of possible combination pairs is to make the value of Kendall's coefficient i.e. tau to fall under -1 to 1 so that it is easier to find out whether the given attribute should be used for predictive analysis of the target value. Unlike other correlations here too, 0 will signify 0 correlation and 1 signifies perfect correlation and -1 signifies the negative correlation.
Mathematical Formula for Kendall's Tau Correlation
The mathematical formula for the Kendall's Tau correlation is:
((Number of concordant pairs) - (number of discordant pairs))/(N(N-1))/2
Here, (N(N-1))/2 is the number of possible pairs in the dataset
Dataset description:
The data set used has two columns i.e.
- YearsExperience
- Salary
The data set tell about the salary of the different employees based on the years of experience in their field so we would be using correlation to find out the relation between years of experience and the salary.
The data set can be downloaded from here: Salary_Data.csv
Now without wasting any time let us write the python code for the following correlation.
Python Implementation of Kendall's Tau Correlation
# -*- coding: utf-8 -*-
"""
Created on Sun Jul 29 22:21:12 2018

@author: Raunak Goswami
"""

import numpy as np
import pandas as pd
import matplotlib.pyplot as plt

#reading the data
"""
here the directory of my code and the headbrain4.csv
file is same make sure both the files are stored in
the same folder or directory
"""
data=pd.read_csv('Salary_Data.csv')

#this will show the first five records of the whole data
data.head()

#this will create a variable w which has the feature values i.e years of experience
w=data.iloc[:,0:1].values
#this will create a variable x which has the feature values i.e salary
y=data.iloc[:,1:2].values

print(round(data['YearsExperience'].corr(data['Salary'],method='kendall')))
plt.scatter(w,y,c='red')
plt.title('scattered graph for kendall correlation between years of experience and salary' )
plt.xlabel('Gender')
plt.ylabel('brain weight')
plt.show()

data.info()
data['YearsExperience'].corr(data['Salary'])
k1=data.corr(method='kendall')
print("The table for all possible values of kendall'scoeffecients is as follows")
print(k1)
Output
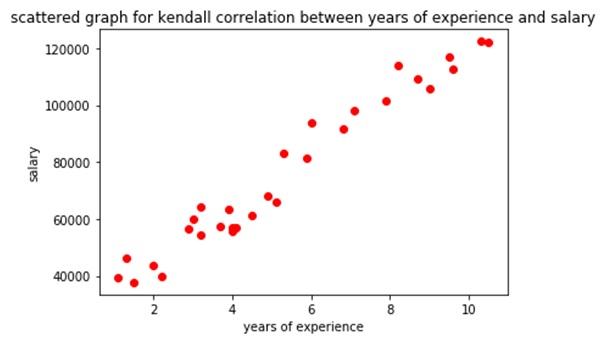
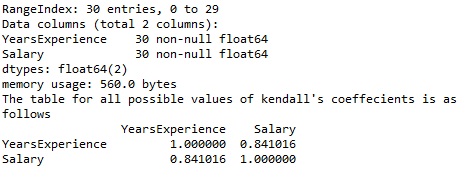
From the given output the value of Kendall tau's correlation coefficient between years of experience and salary comes out to be 0.841016 which is a fairly good correlation value. That was all for today guys hope you liked this article. Keep learning.
Advertisement
Advertisement