Home »
Machine Learning/Artificial Intelligence
Split a Dataset into Train and Test Sets using Python
In this tutorial, we will learn how to split a dataset into train and test sets using Python?
By Raunak Goswami Last updated : April 16, 2023
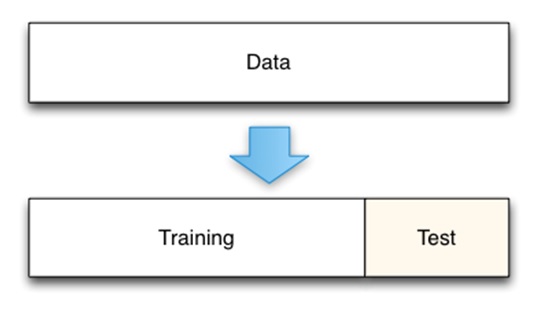
Before going to the coding part, we must be knowing that why is there a need to split a single data into 2 subsets i.e. training data and test data.
What is Training Data?
So, at first, we would be discussing the training data. We use training data to basically train our model. Training data is a complete set of feature variables or the independent variable and target variable or the dependent variable .so that our model is able to learn the value of target variable on a particular set of feature variables. When encountered with a large set of data we use the major portion of data as a training set.
What is Test Data?
After supplying training data now it is the time to test that how much our model has learned from that data just like as humans in college after we learn our subjects we are required to give the test to clear the subject. We test our model by supplying the feature variables to our model and in turn, we see the value of the target variable predicted by our model. We generally take a minor portion of the whole data as the test set which is generally 25% or 33% of the complete data set.
This figure below shows the splitting of data into test and training sets:
For performing the data splitting. I would be using this data set: headbrain1.CSV
Python Code to Split a Dataset into Train and Test Sets
# -*- coding: utf-8 -*-
"""
Created on Sun Jul 29 22:21:12 2018

@author: RaunakGoswami
"""

import numpy as np
import pandas as pd
import matplotlib.pyplot as plt

#reading the data
"""here the directory of my code and the headbrain1.csv
file is same make sure both the files are stored in
same folder or directory"""
data=pd.read_csv('headbrain1.csv')

#this will show the first five records of the whole data
data.head()

#this will create a variable x which has the feature values
#i.e brain weight
x=data.iloc[:,2:3].values
#this will create a variable y which has the target value
#i.e brain weight
y=data.iloc[:,3:4].values


#splitting the data into training and test
"""the following statement written below will split
x and y into 2 parts:
	1.training variables named x_train and y_train
	2.test variables named x_test and y_test
The splitting will be done in the ratio of 1:4 as we have
mentioned the test_size as 1/4 of the total size"""
from sklearn.cross_validation import train_test_split
x_train,x_test,y_train,y_test=train_test_split(x,y,test_size=1/4,random_state=0)

#this will plot the scattered graph of the training set
plt.scatter(x_train,y_train,c='red')

plt.xlabel('headsize(train)')
plt.ylabel('brain weight(train)')
plt.show()

#this will plot the scattered graph of test set
plt.scatter(x_test,y_test,c='red')
plt.xlabel('headsize(test)')
plt.ylabel('brain weight(test)')
plt.show()
After you run this code, just look into the variable explorer and you will see something like this:
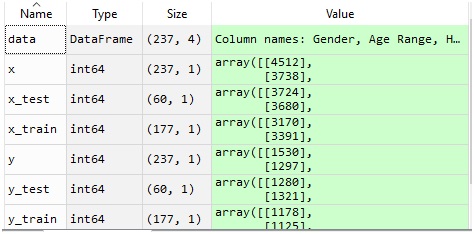
As it is clearly visible that out of 237 rows ,177 rows are allotted to training variables and the remaining 60 rows are allotted to test variables which is roughly ¼ of the total dataset.
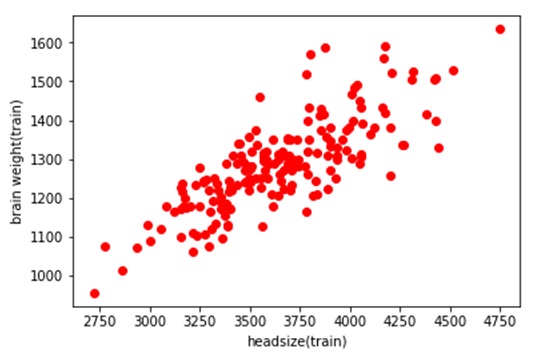
The graph below is a scattered graph of the training set variables:
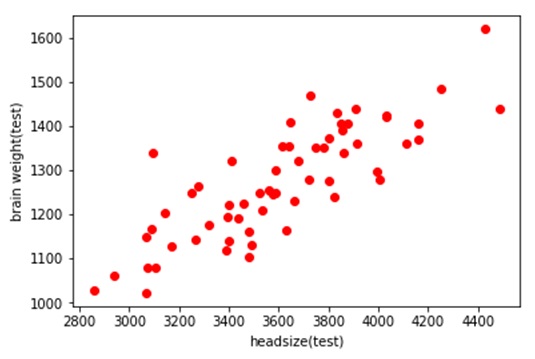
The graph below is a scattered graph of test set values notice that the number of scattered red dots are lesser than those in training set:
Advertisement
Advertisement