Home »
Machine Learning/Artificial Intelligence
Probabilistic Graphical Model (PGMs) Algorithm in Machine Learning
In this tutorial, we are going to discuss about PGMs (probabilistic graphical model) Algorithm in machine learning.
By Bharti Parmar Last updated : April 16, 2023
What is PGM?
The PGM is:
- P: Probabilistic
- G: Graphic
- M: Models
Probabilistic
The nature of the problem that we are generally interested to solve or the type of queries interested to solve or the type of queries we want to make is all probabilistic because of uncertainty. There are many reasons that contribute to it.
- Incomplete knowledge
- Noisy observation
- Some Attributes that contribute to the problem that counts and has not present in the model
Graphical
It helps us to visualize better and we use graph theory to reduce the number of relevant combinations of all the participating variables to represent the high dimensional probability distribution model more compactly.
Model
A model is a declarative (means declare and defined not derived either by a domain expert by using their domain knowledge and by using statistical knowledge and learning algorithms with historical datasets) representation of a real-world scenario or a problem that we want to analyze. It is represented by using mathematical tools like graph or simple by an equation.
What is Probabilistic Graphical Model (PGMs) Algorithm?
It is a technique of closely representing a joint distribution (a rich framework for encoding probability distributions over complex domains) by exploiting dependencies between the random variables. They are used to create a model for real-world scenarios and represent them in the compact graphical representation. It is also allowing us to do inference on joint distribution in a computationally cheaper way than the traditional methods. You can achieve in one line what you would traditionally ways to solve. This is in itself is very abstract and involves many terms that need its own speaks.
Representations are done at the intersection of statistics and computer science. It relies on ideas of probability theory, graph algorithms, machine learning. It has a wide variety of applications Like medical diagnosis, image understanding, speech recognition, NLP, and many more. They are also an initial tool in conveying ML problems.
Whether the graph is directed or undirected, it classifies graphical modes into two ways — Bayesian networks and Markov networks. By knowing the PGMs algorithm we can easily understand what is Bayesian network, graphical model and Markov’s field model.
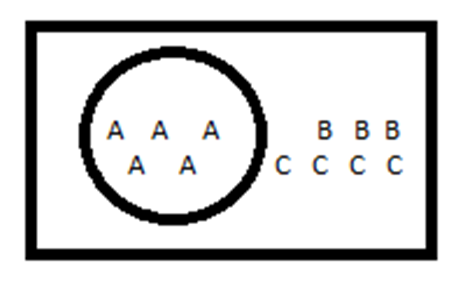
DIA. Example of probability:
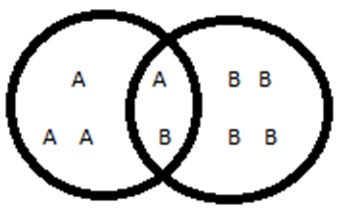
DIA. Example of Conditional Probability:
Different kinds of distribution
- Joint distribution: It describes how two or more variables are distributed simultaneously. To get a probability from the joint distribution of A and B, you would consider P(A=a and B=b).
- Probability distribution: Conditional probability distribution looks at how the probabilities of A are distributed, given a certain value, say, for B, P(A=a | B=b).
- Marginal distribution: It is one that results from taking a mean over one variable to get the probability distribution of the other. Like: the marginal probability distribution of A and B are related would be given by the following:
∫B P(a│b)P(b)db
Need of Probabilistic Graphical Model (PGMs) Algorithm
We have many algorithms for working with graphs and statistics. Using PGMs we can simulate dynamics even of a nuclear power plant, create models of chemical components and many other things. So, the probabilistic graphical model is very rich frameworks for encoding probabilistic distributions aver complex domains.
1. Compact graphical representation
It is a PGM framework used to create and represent compact graphical models of complex real-world scenarios.
2. Intuitive diagram of complex relationships
PGM give us an intuitive diagram of the complex relationship between stochastic variables.
3. Convenient from computational aspects
PGM also convenient from the computational point of view, since we already have algorithms for working with graphics and statistics.
4. Dynamic simulation of models
Using PGM we can simulate dynamics of industrial establishments, create models and many other things.
Example of Probabilistic Graphical Model (PGMs) Algorithm
- We have an image and we have to predict it contains a dog or cat in the image or we have an image of handwritten characters where we have to predict any 0-9 digit and A-Z character. Then, here, we use PGMs algorithm.
- We have a sentence like: "I am using PGM algorithm". So, here we have to use PGMs algorithm to predict this sentence; so, here learning could be part-of-speech (noun, pronoun, verb, adjective). This is important for a lot of difficult tasks such that: translate one language to another, text to speech.
-
We can take an example of badminton to understand the concept of PGM: Consider, we have 4 binaries (yes/No) variable. Binary has two possible outcomes YES or NO.
- Spot in the Olympic (yes/no)
- Performance in the previous game (yes/no)
- Good genetics (yes/no)
- Good practice (yes/no)
Now, the coach has to look out the two ways for the Olympics:
- We have to use what we know about the relationships between variables to get information about more other difficult relationships.
- Try to store our data and probability in a form where it is easy to input evidence and get out updated information.
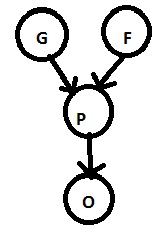
Components of graphical models
Nodes = Random variables and Edges = inter nodal dependencies
Sometimes, all the variables are available for observation and sometimes for subsets.
Applications of Probabilistic Graphical Model (PGMs) Algorithm
The following are the Probabilistic Graphical Model (PGMs) Algorithm:
- Netflix, Amazon, facebook all use PGM recommend what is best for you.
- This algorithm, Use the latent factor model and non-negative matrix factorization.
- In politics American presidential polls using PGMs for prediction. FiveThirtyEight company that makes a prediction about American presidential polls using PGMs.
- PGM is also inferred whether one is a MODI and KEJRIWAL supporter.
Conclusion
In this tutorial, we have learned what is PGM with example and its different kinds of distribution? We will learn more about ML in the upcoming article. Have a nice day! Happy learning!
Advertisement
Advertisement