Home »
Machine Learning/Artificial Intelligence
Linear Regression in Machine Learning
In this article, we are going to discuss about linear regression and its implication in the field of machine learning.
By Raunak Goswami Last updated : April 16, 2023
Overview
Most of you reading this article must be having a fair idea of the term machine learning. If we talk in lay man’s language it is basically an application of artificial intelligence wherein we give in a set of data to a machine and make the machine train and learn using those data. Now the question arises that how will the machine learn on its own? There has to be some algorithm or you can say a method which will help the machine to learn through the data provided by us. We have numerous algorithms from mathematics that we use in machine these algos are broadly categorized into 2 parts:
- Regression
- Classification
What is Linear Regression?
Well, regression is used basically when we are dealing with continuous sets of data and classification is applied when the data set used is scattered.
To start with, we are going to discuss one of the simplest regression i.e. linear regression and we will code a simple machine learning programme to predict the relationship between the head size and the brain weight of different users.
Example: Linear Regression Implementation
Question
To start with we have taken the data of 237 users. The data is in the form of a .csv format that contains the following details about the users:
- Gender
- Age range
- Head size
- Brain Weight
Solution
The best way to describe the relationship is by using graphs and images so for that we will take values of head size in x-axis (dependent variable) and values of brain Weight in y-axis (independent variable) and will plot the graph between then we start of by splitting the data into train and test set, train data will be used to train our model and test set will be used for testing the accuracy using the code:
from sklearn.cross_validation import train_test_split
x_train,x_test,y_train,y_test=train_test_split(x,y,test_size=1/4,random_state=0).
After plotting a scattered graph of the trainning set, we get the following result:
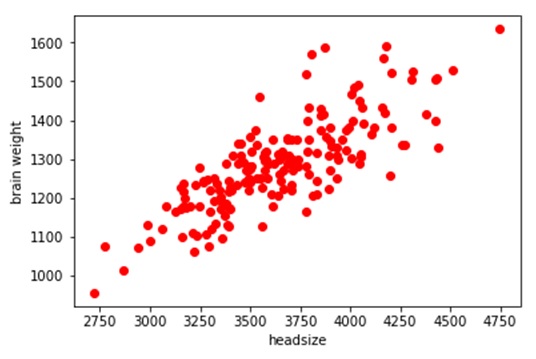
From here we can easily see that the relationship between the brain weight and head size is following a positive linear pattern. Therefore, to predict the values in the test set we would be using Linear regression.
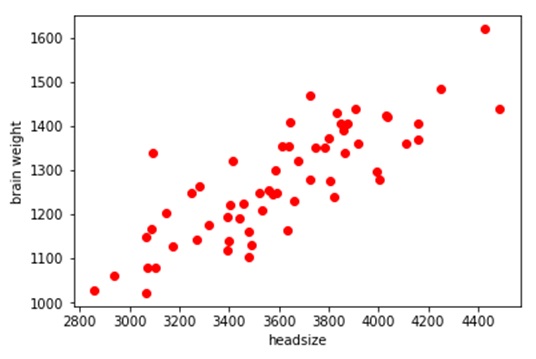
As we draw a scattered graph between the test values we get the similar type of a graph:
Now in order to predict the test set values, we need to fit in the values in the training set into the linear regression function using the following code:
    from sklearn.linear_model import LinearRegression
    regressor=LinearRegression()
    regressor.fit(x_train,y_train)
After fitting in the linear regression function. This is how we get the predicted values of brain weight using linear regression:
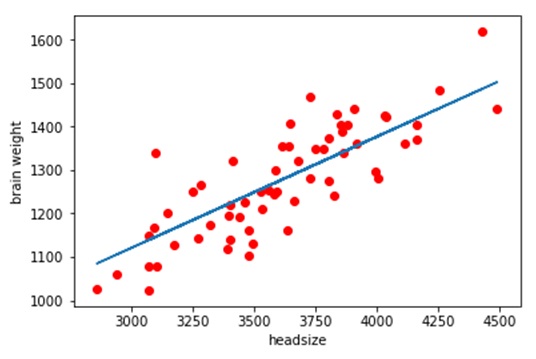
Here the increasing liner slope is the predicted set of values using linear regression algos and the red dots are the actual test values from here we can say that our mode performed fairly well in predicting brain weight values from head size values in the test set.
Linear Regression Implementation using Python
Below is code for linear regression which is written in Python. It is advisable to run this code in the SPYDER tool provided by ANACONDA which works on python 3.6. Library used for regression is scikit learn. The dataset is in the form of .csv can be downloaded from here (headbrain.CSV).
# -*- coding: utf-8 -*-
"""
Created on Sun Jul 29 22:21:12 2018

@author: Logan
"""

import numpy as np
import pandas as pd
import matplotlib.pyplot as plt
#reading the data
"""	here the directory of my code and the headbrain.csv
	file is same make sure both the files are stored in
	the same folder or directory"""

data=pd.read_csv('headbrain.csv')
data.head()

x=data.iloc[:,2:3].values
y=data.iloc[:,3:4].values

#splitting the data into training and test
from sklearn.cross_validation import train_test_split
x_train,x_test,y_train,y_test=train_test_split(x,y,test_size=1/4,random_state=0)

#fitting simple linear regression to the training set
from sklearn.linear_model import LinearRegression
regressor=LinearRegression()
regressor.fit(x_train,y_train)

#predict the test result
y_pred=regressor.predict(x_test)

#to see the relationship between the training data values
plt.scatter(x_train,y_train,c='red')
plt.show()

#to see the relationship between the predicted brain weight values using scattered graph
plt.plot(x_test,y_pred)
plt.scatter(x_test,y_test,c='red')
plt.xlabel('headsize')
plt.ylabel('brain weight')
Advertisement
Advertisement