Home »
Python »
Python Data Visualization
Python | Adding Text to the Plot
Python | matplotlib.pyplot.text(): Here, we will learn how to add text to the plot in Python?
Submitted by Anuj Singh, on July 14, 2020
Adding text to a plot is one of the most used features of matplotlib.pyplot and there is a function defined for this operation i.e. matplotlib.pyplot.text().
The following example shows the usage of this function.
Reference: https://matplotlib.org/
Python code for adding text to the plot
# Data Visualization using Python
# Adding Text
import numpy as np
import matplotlib.pyplot as plt
x = np.arange(50)
y1 = np.arange(50)
for i in range(50):
y1[i] = 2*x[i] + np.random.randint(0,5)
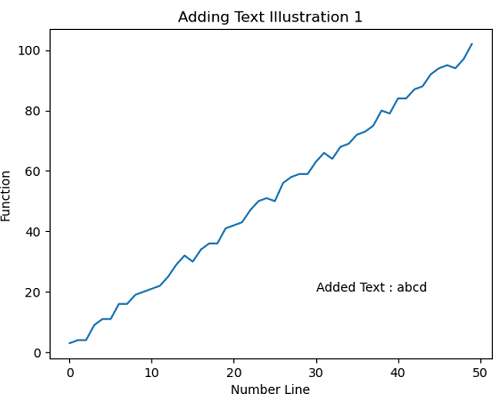
# Adding Text Illustration 1
plt.figure()
plt.plot(x,y1)
plt.xlabel('Number Line')
plt.ylabel('Function')
plt.title('Adding Text Illustration 1')
plt.text(30,20,'Added Text : abcd')
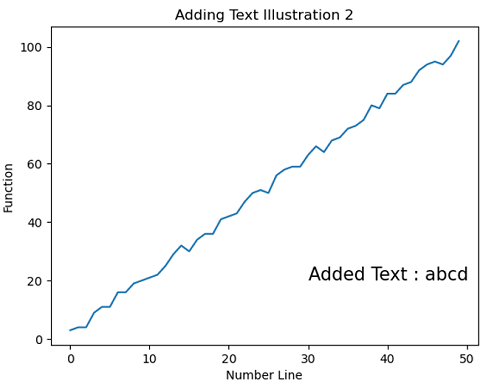
# Adding Text Illustration 2
plt.figure()
plt.plot(x,y1)
plt.xlabel('Number Line')
plt.ylabel('Function')
plt.title('Adding Text Illustration 2')
plt.text(30,20,'Added Text : abcd', fontsize=15)
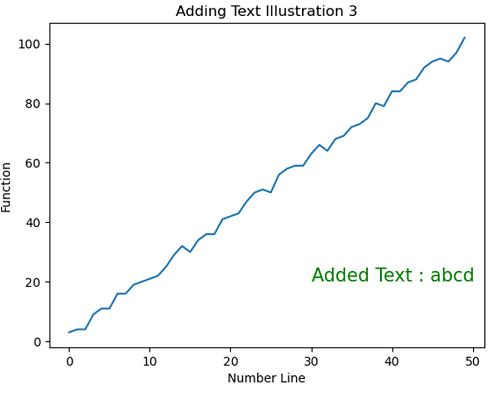
# Adding Text Illustration 3
plt.figure()
plt.plot(x,y1)
plt.xlabel('Number Line')
plt.ylabel('Function')
plt.title('Adding Text Illustration 3')
plt.text(30,20,'Added Text : abcd', fontsize=15, color='g')
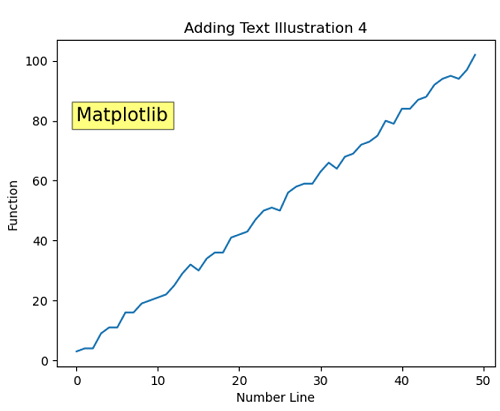
# Adding Text Illustration 4
plt.figure()
plt.plot(x,y1)
plt.xlabel('Number Line')
plt.ylabel('Function')
plt.title('Adding Text Illustration 4')
plt.text(0,80, 'Matplotlib', bbox=dict(facecolor='yellow', alpha=0.5), fontsize=15)
Output:
Output is as figure
Advertisement
Advertisement