Home »
Python
Pandas dataframe.groupby() Method
Python Pandas GroupBy | dataframe.groupby() Method: In this tutorial, we are going to learn about the Pandas GroupBy in Python with examples.
By Sapna Deraje Radhakrishna Last updated : August 24, 2023
Pandas dataframe.groupby() Method
Pandas dataframe.groupby() method can be used to work on group rows of data together and call aggregate functions. It allows to group together rows based off of a column and perform an aggregate function on them.
Syntax
DataFrame.groupby(
    by=None,
    axis=0,
    level=None,
    as_index=True,
    sort=True,
    group_keys=True,
    observed=False,
    dropna=True
    )
Example
Consider the below example, there are three partitions of IDS (1, 2, and 3) and several values for them. We can now group by the ID column and aggregate them using some sort of aggregate function. Here we are sum-ing the values and putting the values.
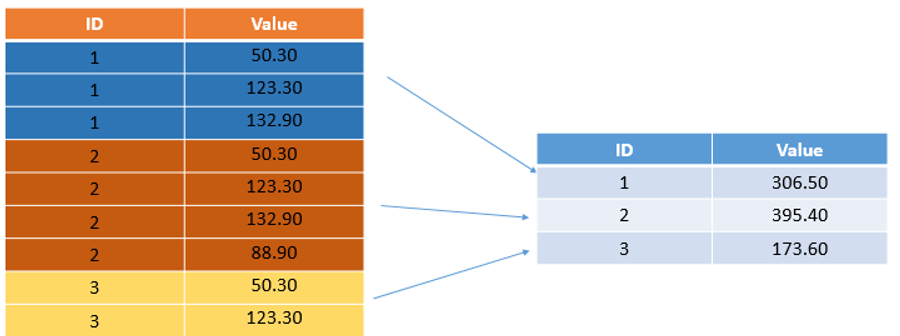
Groupby with Pandas
Create a dataframe from a dictionary
import numpy as np
import pandas as pd

data = {'company':['Google','Microsoft','FB','Google','FB'], 'person':['Molly','Nathaniel', 'Sriansh', 'Carl','Sarah'], 'Sales':[200,123,130,144,122]}

df = pd.DataFrame(data)
print(df)
Output
     company     person  Sales
0     Google      Molly    200
1  Microsoft  Nathaniel    123
2         FB    Sriansh    130
3     Google       Carl    144
4         FB      Sarah    122
Pandas dataframe.groupby() Method Examples
Following examples illustrate the groupby() method,
Example: GroupBy by 'company'
# returns the groubBy object
print(df.groupby('company'))
'''
<pandas.core.groupby.generic.DataFrameGroupBy object at 0x7f1721585350>
'''

by_company = df.groupby('company')
#invoke aggregate function
print(by_company.mean())
'''
           Sales
company
FB           126
Google       172
Microsoft    123
'''
In the above example, we don't see the person column, because the data type is String and by no means, we can get mean of String variables, and hence Pandas automatically ignores any non-numeric values.
Example of aggregate function
Below are some more examples of aggregate functions,
print(by_company.sum())

'''
Output:
           Sales
company
FB           252
Google       344
Microsoft    123
'''
print(by_company.std())

'''
Output:
               Sales
company
FB          5.656854
Google     39.597980
Microsoft        NaN
'''
Example: Return type
Note the return type of the values are by default a DataFrame, as illustrated below,
std = by_company.std()
print(type(std))

'''
Output:
<class 'pandas.core.frame.DataFrame'>
'''
And, hence we can perform all the dataFrame functions such as,
print(by_company.std().loc['FB'])

'''
Output:
Sales    5.656854
Name: FB, dtype: float64
'''
The above mentioned steps, all can be performed in a single step as follows,
print(df.groupby('company').sum().loc['FB'])

'''
Output:
Sales    252
Name: FB, dtype: int64
'''
Some more aggregate functions are,
print(df.groupby('company').count())

'''
Output:
           person  Sales
company
FB              2      2
Google          2      2
Microsoft       1      1
'''

print(df.groupby('company').max())

'''
Output:
              person  Sales
company
FB           Sriansh    130
Google         Molly    200
Microsoft  Nathaniel    123
'''

print(df.groupby('company').min())

'''
Output:
              person  Sales
company
FB             Sarah    122
Google          Carl    144
Microsoft  Nathaniel    123
'''
Using GroupBy with describe() method
The describe() method returns a bunch of useful information all at once.
print(df.groupby('company').describe())

'''
Output:
          Sales                    ...
          count   mean        std  ...    50%    75%    max
company                            ...
FB          2.0  126.0   5.656854  ...  126.0  128.0  130.0
Google      2.0  172.0  39.597980  ...  172.0  186.0  200.0
Microsoft   1.0  123.0        NaN  ...  123.0  123.0  123.0

[3 rows x 8 columns]
'''
The format of the description can be changed using transpose() method,
print(df.groupby('company').describe().transpose())

'''
Output:
company              FB     Google  Microsoft
Sales count    2.000000    2.00000        1.0
      mean   126.000000  172.00000      123.0
      std      5.656854   39.59798        NaN
      min    122.000000  144.00000      123.0
      25%    124.000000  158.00000      123.0
      50%    126.000000  172.00000      123.0
      75%    128.000000  186.00000      123.0
      max    130.000000  200.00000      123.0
'''
Advertisement
Advertisement