Home »
Python »
Python Data Visualization
Python | Filled Contour Plot with Gradient
In this tutorial, we are going to learn filled contour plots with gradients in Python using matplotlib.
Submitted by Anuj Singh, on August 21, 2020
Illustrations:

Python code for filled contour plot with gradient
import matplotlib.pyplot as plt
import numpy as np
from numpy import ma
from matplotlib import ticker, cm
N = 100
x = np.linspace(-3.0, 3.0, N)
y = np.linspace(-2.0, 2.0, N)
X, Y = np.meshgrid(x, y)
Z1 = np.exp(-X**2 - Y**2)
Z2 = np.exp(-(X * 10)**2 - (Y * 10)**2)
z = Z1 + 50 * Z2
z[:5, :5] = -1
z = ma.masked_where(z <= 0, z)
fig, ax = plt.subplots()
cs = ax.contourf(X, Y, z, locator=ticker.LogLocator(), cmap='inferno')
ax.axis(False)
plt.show()
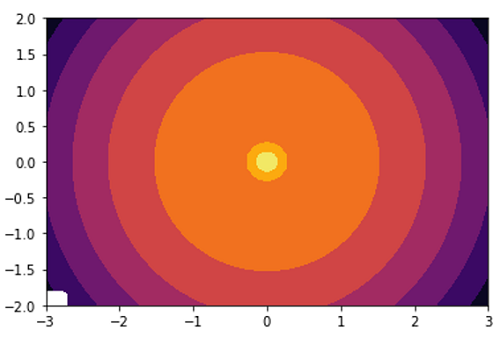
fig, ax = plt.subplots()
cs = ax.contourf(X, Y, z, locator=ticker.LogLocator(), cmap='inferno')
ax.axis(True)
plt.show()
Output:
Output is as Figure
Advertisement
Advertisement