Home »
Python »
Python Data Visualization
Python | Gradient Bar Graph
In this tutorial, we are going to plot a bar graph with gradients in Python using matplotlib?
Submitted by Anuj Singh, on August 20, 2020
Illustrations:
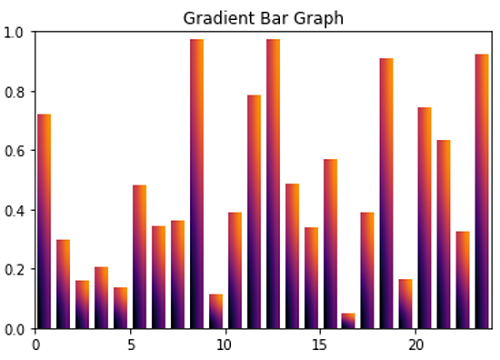
Python code for gradient bar graph
import matplotlib.pyplot as plt
import numpy as np

def gradient_image(ax, extent, direction=0.3, cmap_range=(0, 5), **kwargs):
    phi = direction * np.pi / 2
    v = np.array([np.cos(phi), np.sin(phi)])
    X = np.array([[v @ [1, 0], v @ [1, 1]],
                  [v @ [0, 0], v @ [0, 1]]])
    a, b = cmap_range
    X = a + (b - a) / X.max() * X
    im = ax.imshow(X, extent=extent, interpolation='bicubic',
                   vmin=0, vmax=1, **kwargs)
    return im


def grabargraph(ax, x, y, width=0.5, bottom=0):
    for left, top in zip(x, y):
        right = left + width
        gradient_image(ax, extent=(left, right, bottom, top),
                       cmap='inferno', cmap_range=(0, 0.8))

xmin, xmax = xlim = 0, 24
ymin, ymax = ylim = 0, 1

fig, ax = plt.subplots()
ax.set(xlim=xlim, ylim=ylim)

N = 24
x = np.arange(N) + 0.15
y = np.random.rand(N)
grabargraph(ax, x, y, width=0.7)
ax.set_aspect('auto')
ax.set_title('Gradient Bar Graph')
plt.show()

############################################
############################################

import matplotlib.pyplot as plt
import numpy as np

def gradient_image(ax, extent, direction=0.03, cmap_range=(0, 5), **kwargs):
    phi = direction * np.pi / 2
    v = np.array([np.cos(phi), np.sin(phi)])
    X = np.array([[v @ [1, 0], v @ [1, 1]],
                  [v @ [0, 0], v @ [0, 1]]])
    a, b = cmap_range
    X = a + (b - a) / X.max() * X
    im = ax.imshow(X, extent=extent, interpolation='bicubic',
                   vmin=0, vmax=1, **kwargs)
    return im


def grabargraph(ax, x, y, width=0.5, bottom=0):
    for left, top in zip(x, y):
        right = left + width
        gradient_image(ax, extent=(left, right, bottom, top),
                       cmap='inferno', cmap_range=(0, 0.8))

xmin, xmax = xlim = 0, 24
ymin, ymax = ylim = 0, 1

fig, ax = plt.subplots()
ax.set(xlim=xlim, ylim=ylim)

N = 24
x = np.arange(N) + 0.15
y = np.random.rand(N)
grabargraph(ax, x, y, width=0.7)
ax.set_aspect('auto')
ax.set_title('Gradient Bar Graph')
plt.show()
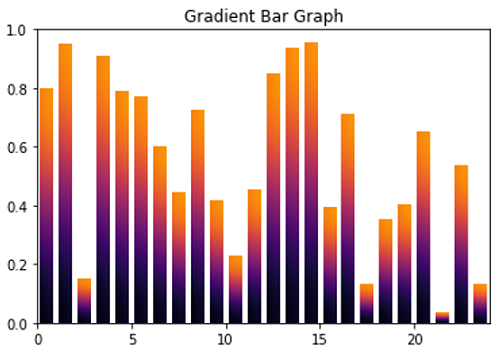
Output:
Output is as Figure
Advertisement
Advertisement