Home »
Python »
Python Data Visualization
Python | Marker Fill Styles in Matplotlib
In this article, we are going to explore different marker fill styles in python matplotlib.
Submitted by Anuj Singh, on August 22, 2020
Illustrations:
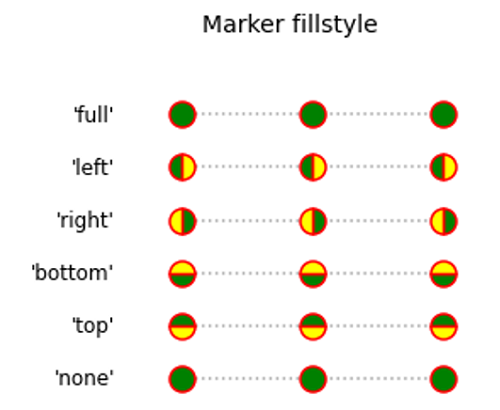
Python code for marker fill styles in matplotlib
import matplotlib.pyplot as plt
from matplotlib.lines import Line2D

text_style = dict(horizontalalignment='right', verticalalignment='center',
                  fontsize=12, fontfamily='monospace')
marker_style = dict(linestyle=':', color='0.8', markersize=10,
                    markerfacecolor="tab:blue", markeredgecolor="tab:blue")

def format_axes(ax):
    ax.margins(0.2)
    ax.set_axis_off()
    ax.invert_yaxis()


fig, ax = plt.subplots()
fig.suptitle('Marker fillstyle', fontsize=14, ha='left')
fig.subplots_adjust(left=0.4)

filled_marker_style = dict(marker='o', linestyle=':', markersize=15,
                           color='darkgrey',
                           markerfacecolor='tab:blue',
                           markerfacecoloralt='lightsteelblue',
                           markeredgecolor='brown')

for y, fill_style in enumerate(Line2D.fillStyles):
    ax.text(-0.5, y, repr(fill_style), horizontalalignment='right',
            verticalalignment='center', fontsize=12)
    ax.plot([y] * 3, fillstyle=fill_style, marker='o',
            linestyle=':', markersize=15, color='darkgrey',
            markerfacecolor='green',
            markerfacecoloralt='yellow',
            markeredgecolor='Red', markeredgewidth=1.5)
format_axes(ax)

plt.show()
plt.show()
Output:
Output is as Figure
Advertisement
Advertisement